The Setup: NQ 15-Minute Squeeze Into Resistance
Let's talk about what happened today on the NQDefinitionE-mini Nasdaq 100 futures contract. Known for fast, volatile moves. 1 tick = $5, 1 point = $20. — because this is the kind of price action that separates traders who read structure from traders who blow up their accounts.
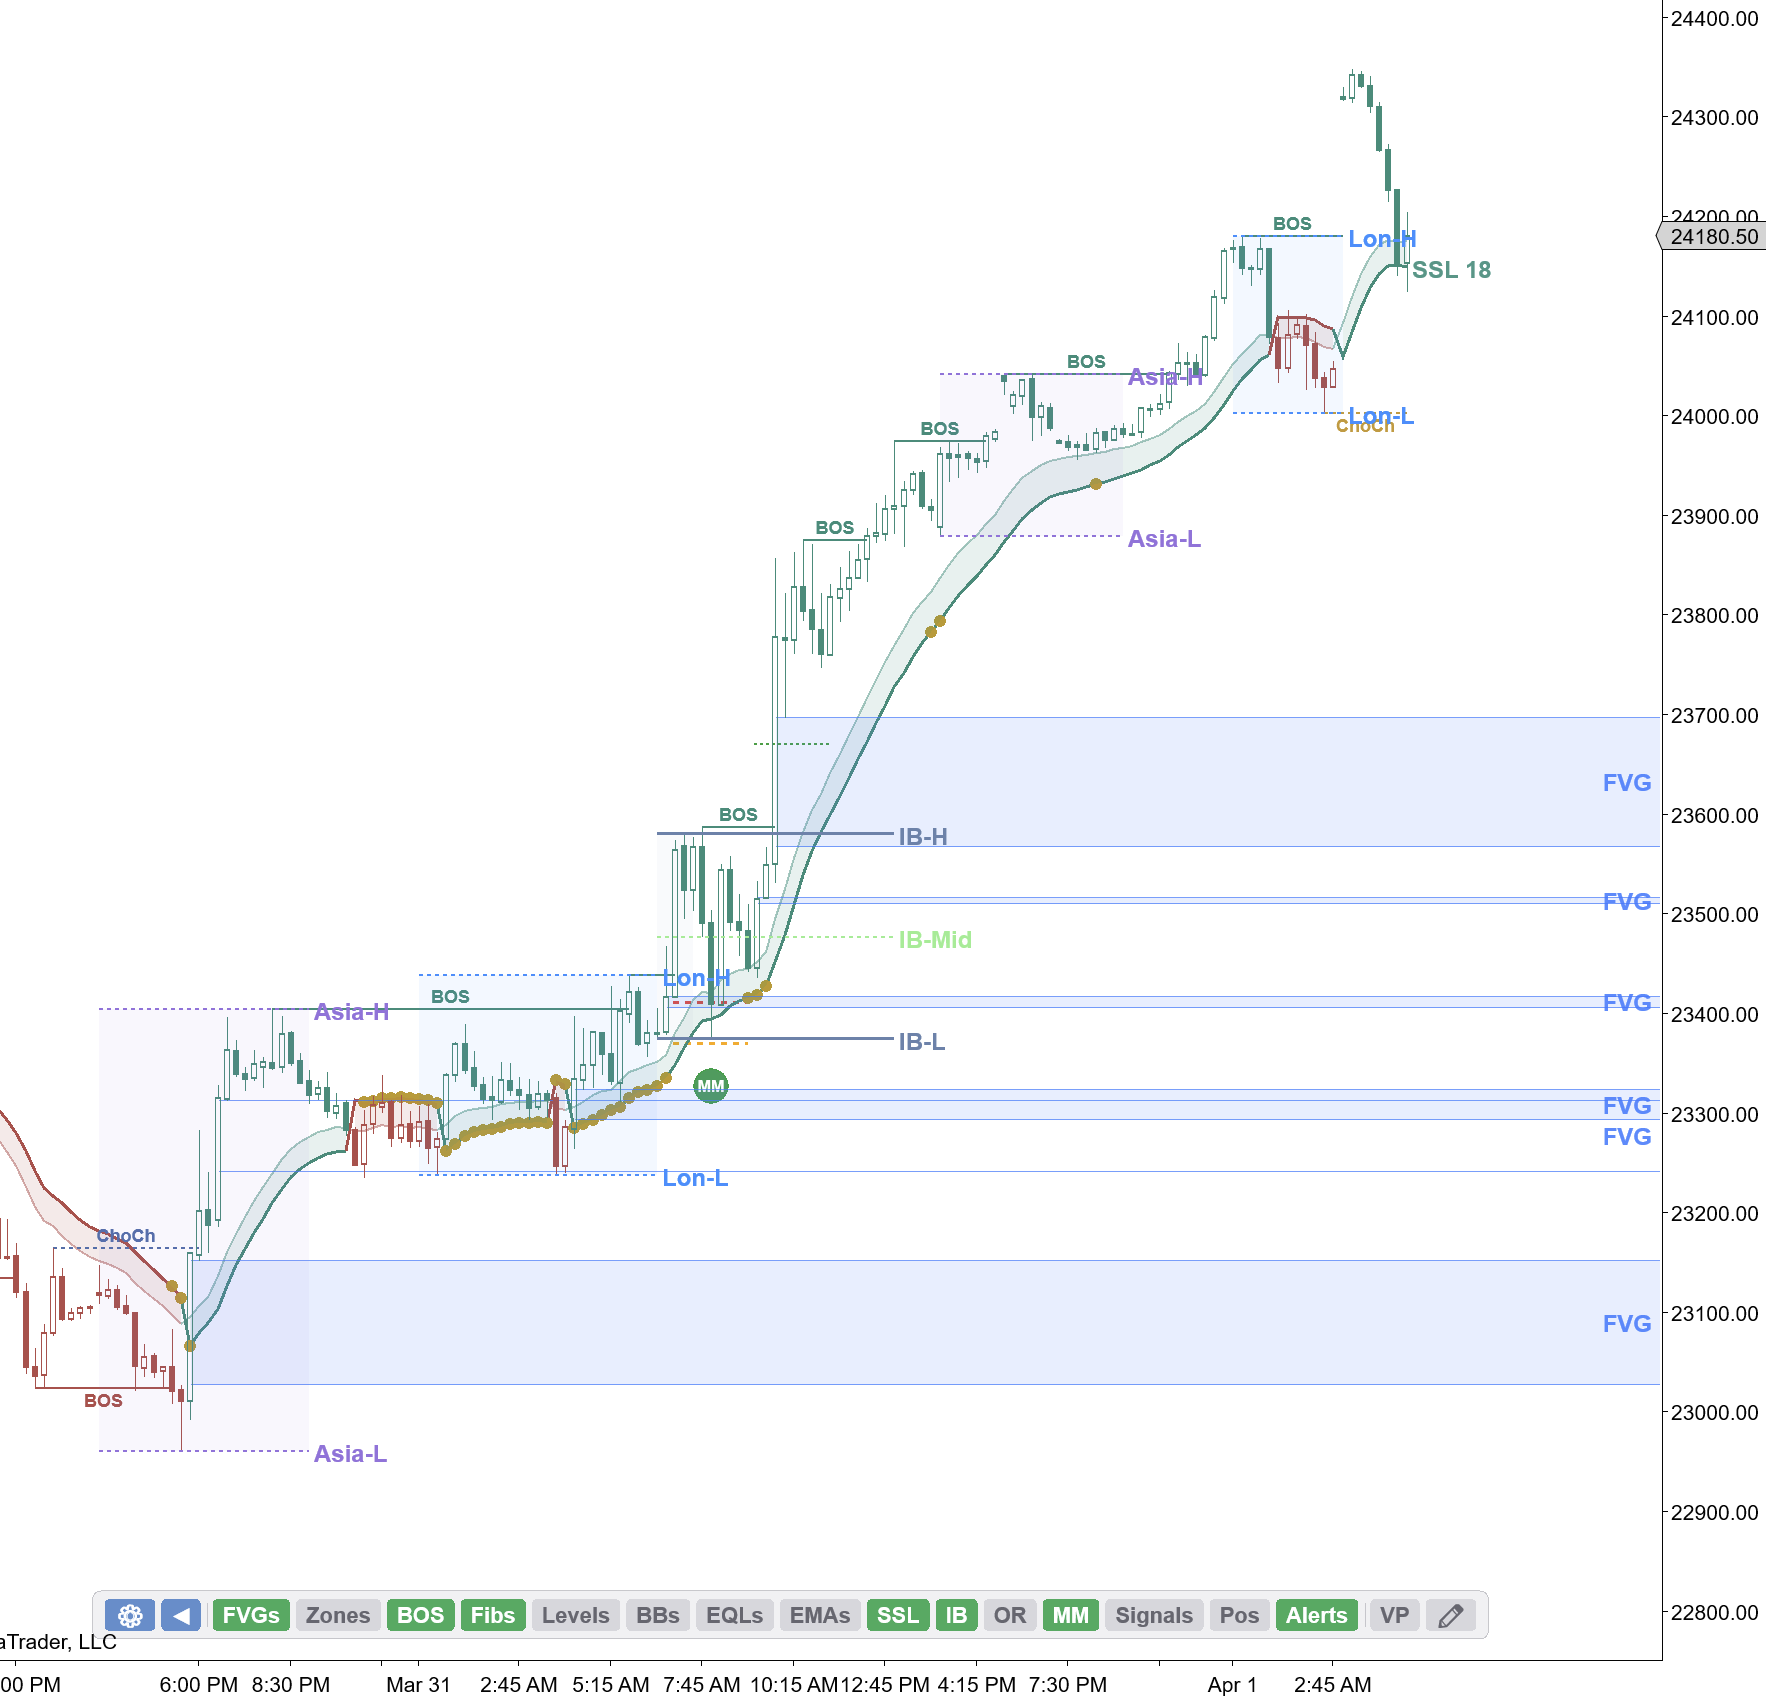
Coming into the session, NQDefinitionE-mini Nasdaq 100 futures contract. Known for fast, volatile moves. 1 tick = $5, 1 point = $20. had a clean BOSDefinitionBreak of Structure — price breaks the previous swing point in the trend direction. Confirms continuation. to the upside. Price was trending, the SSLDefinitionSSL Channel — a trend-following overlay combining moving average crossovers with volatility bands for direction and entries. Cloud was bullish, and everything looked like a straightforward continuation day. Then price pushed into the highs and started squeezing.
But here's what most traders missed: the squeezeDefinitionLow volatility compression — Bollinger Bands inside Keltner Channels. Expect an explosive move when it fires. was the only thing wrong with this setup. Everything else looked bullish — structure, trend, momentum. The one red flag? Price was squeezing into resistance with barely any momentum behind it. No follow-through. No aggressive buying. Just compression.
Here's the question every trader needs to askDefinitionThe lowest price someone is currently willing to sell at. If you buy at market, this is what you pay. themselves: are you really buying here? Into a squeezeDefinitionLow volatility compression — Bollinger Bands inside Keltner Channels. Expect an explosive move when it fires. with no momentum?
Why This Is a Trap
On the surface, everything looks bullish. BOSDefinitionBreak of Structure — price breaks the previous swing point in the trend direction. Confirms continuation. confirmed. Trend is up. But look closer — price is grinding into the high of day with zero energy. The squeezeDefinitionLow volatility compression — Bollinger Bands inside Keltner Channels. Expect an explosive move when it fires. tells you that buyers are running out of steam. There's no conviction behind this push.
When you see a squeezeDefinitionLow volatility compression — Bollinger Bands inside Keltner Channels. Expect an explosive move when it fires. into resistance with barely any momentum, that's not consolidation before a breakout. That's exhaustion.
Key Insight
A squeeze at the highs with no momentum is not accumulation — it's distribution. Smart money is selling into the last of the retail buyers before pulling the rug.
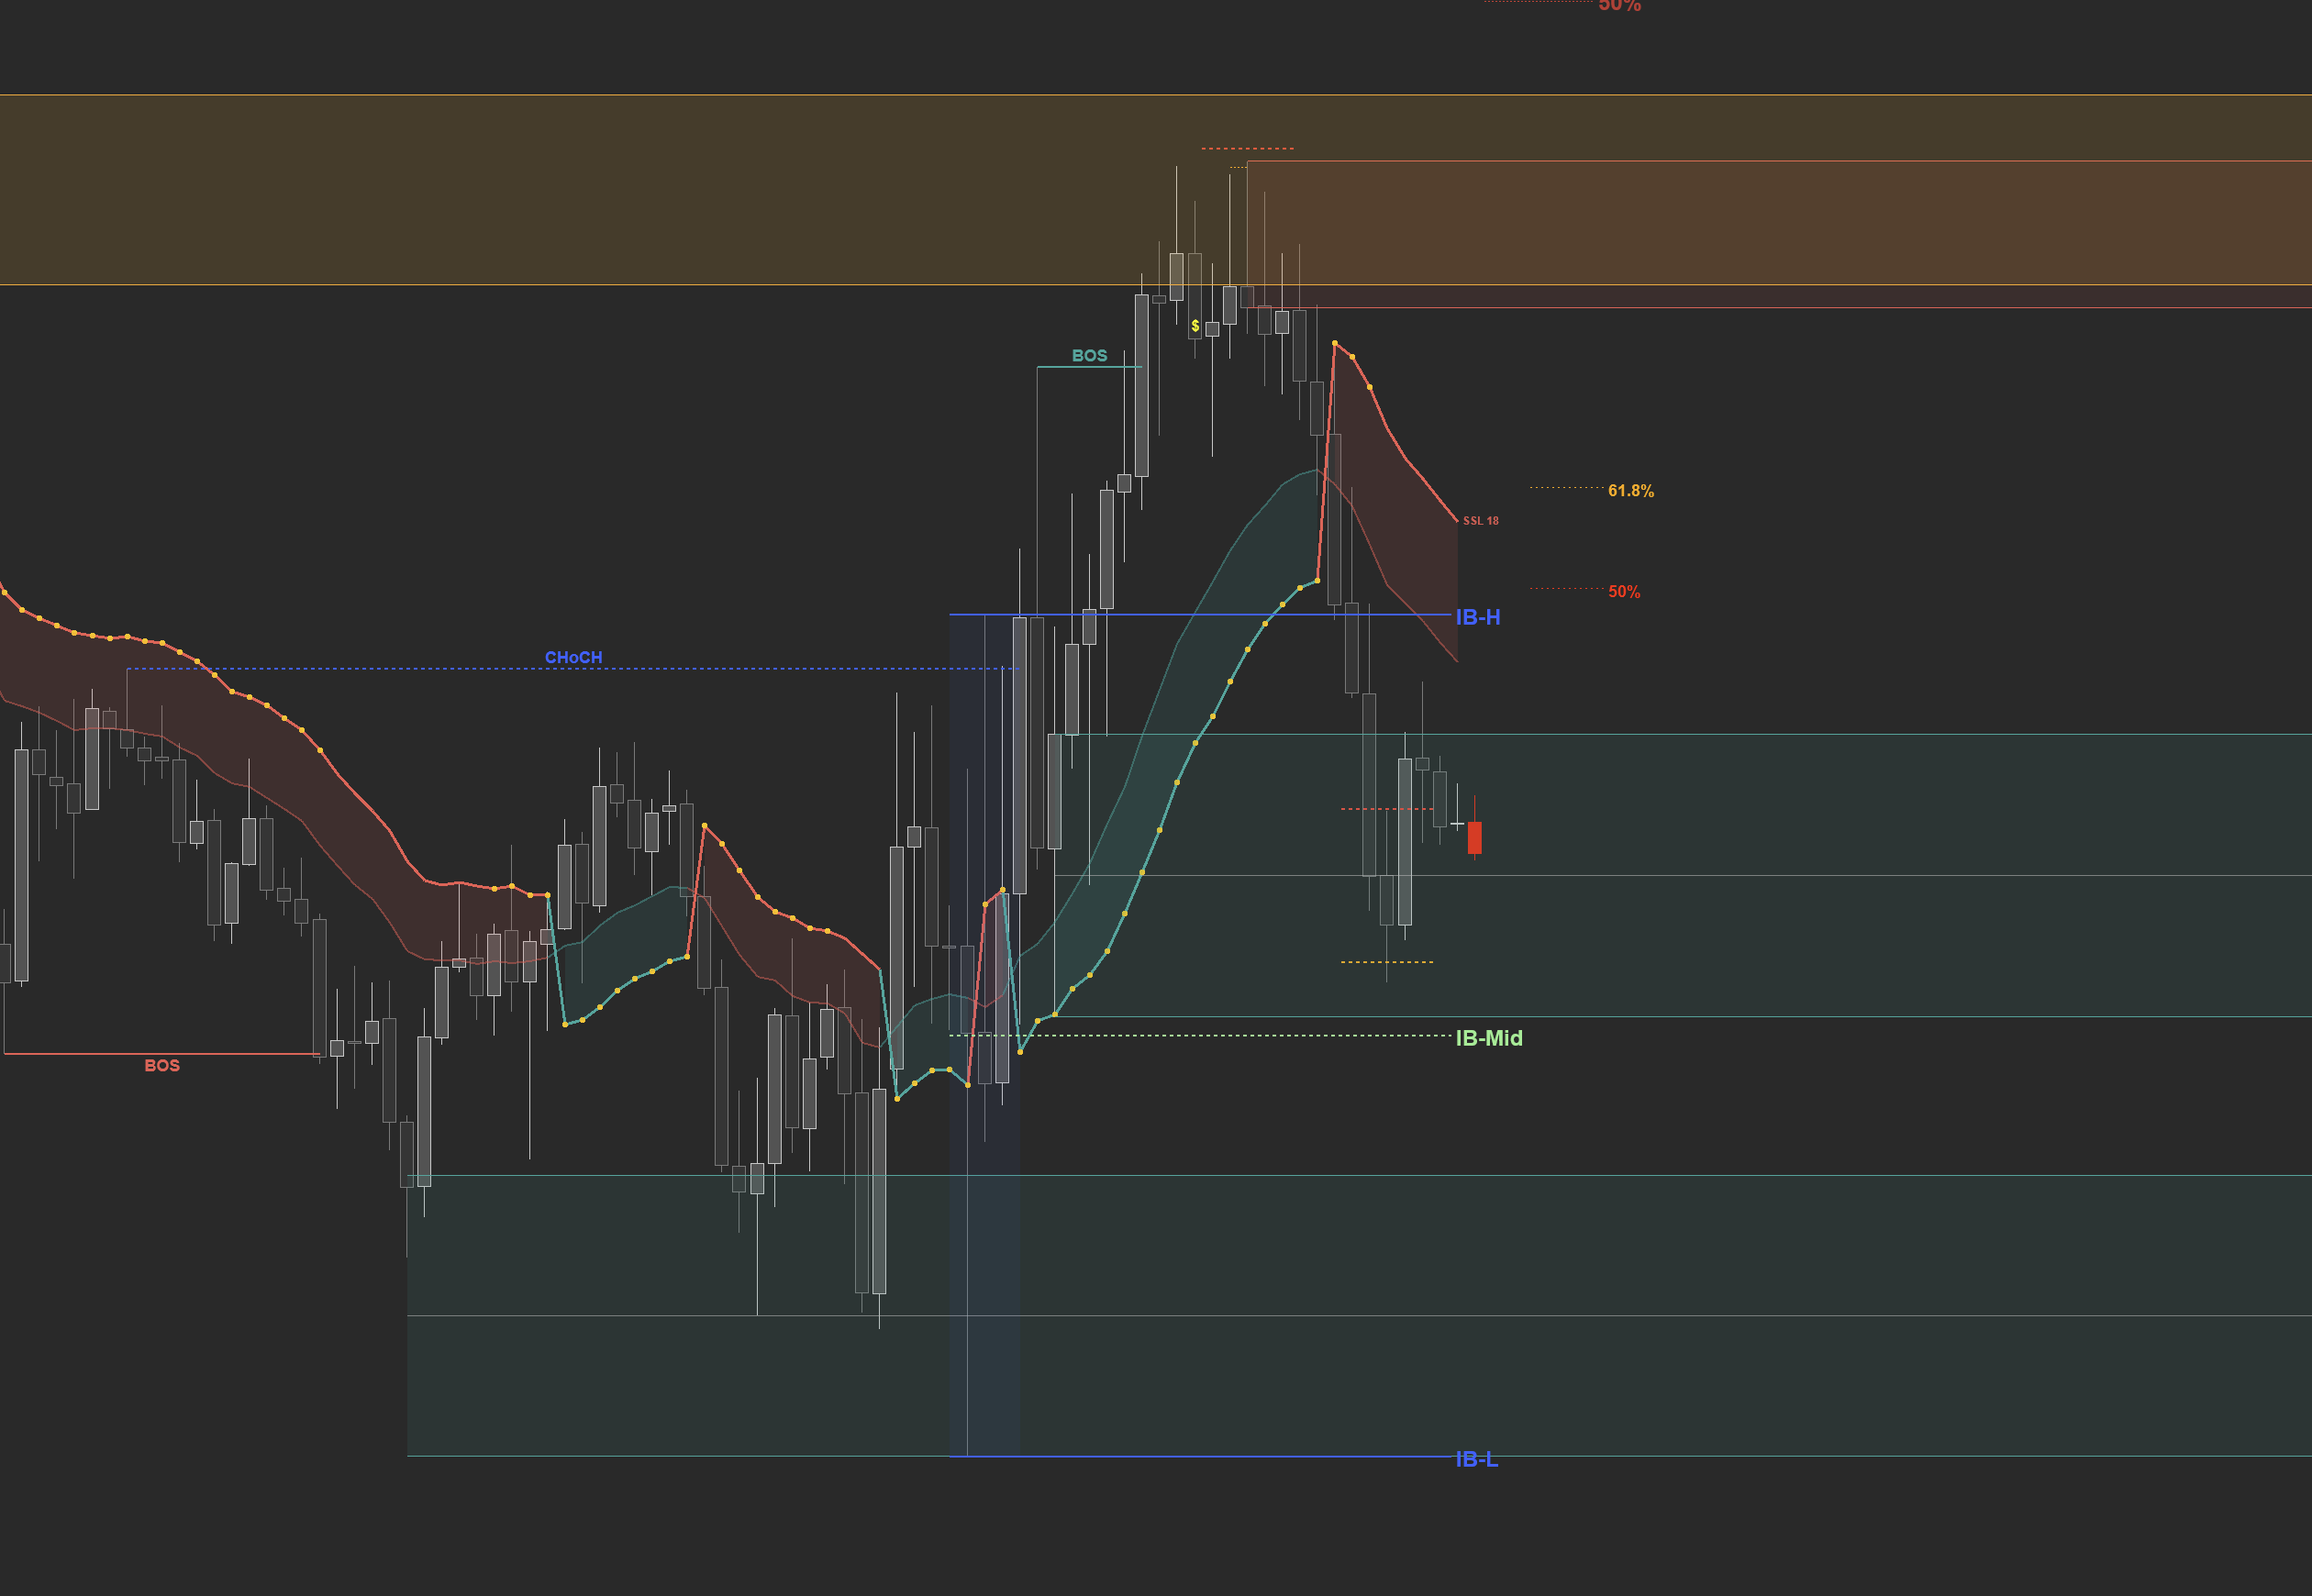
The CHoCHDefinitionChange of Character — the first warning a trend may be ending. Price breaks a swing point against the trend. label fires. The 61.8% fib level is sitting above. The 50% measured moveDefinitionA price projection where Leg B equals Leg A. Primary target is the -23.6% extension beyond 100%. level is staring you in the face. And the only thing holding price up is a squeezeDefinitionLow volatility compression — Bollinger Bands inside Keltner Channels. Expect an explosive move when it fires. that's running on fumes.
The 50% Measured Move Trap
Now look at what actually happened. The measured moveDefinitionA price projection where Leg B equals Leg A. Primary target is the -23.6% extension beyond 100%. short triggered at the 50% level — a perfect entry.
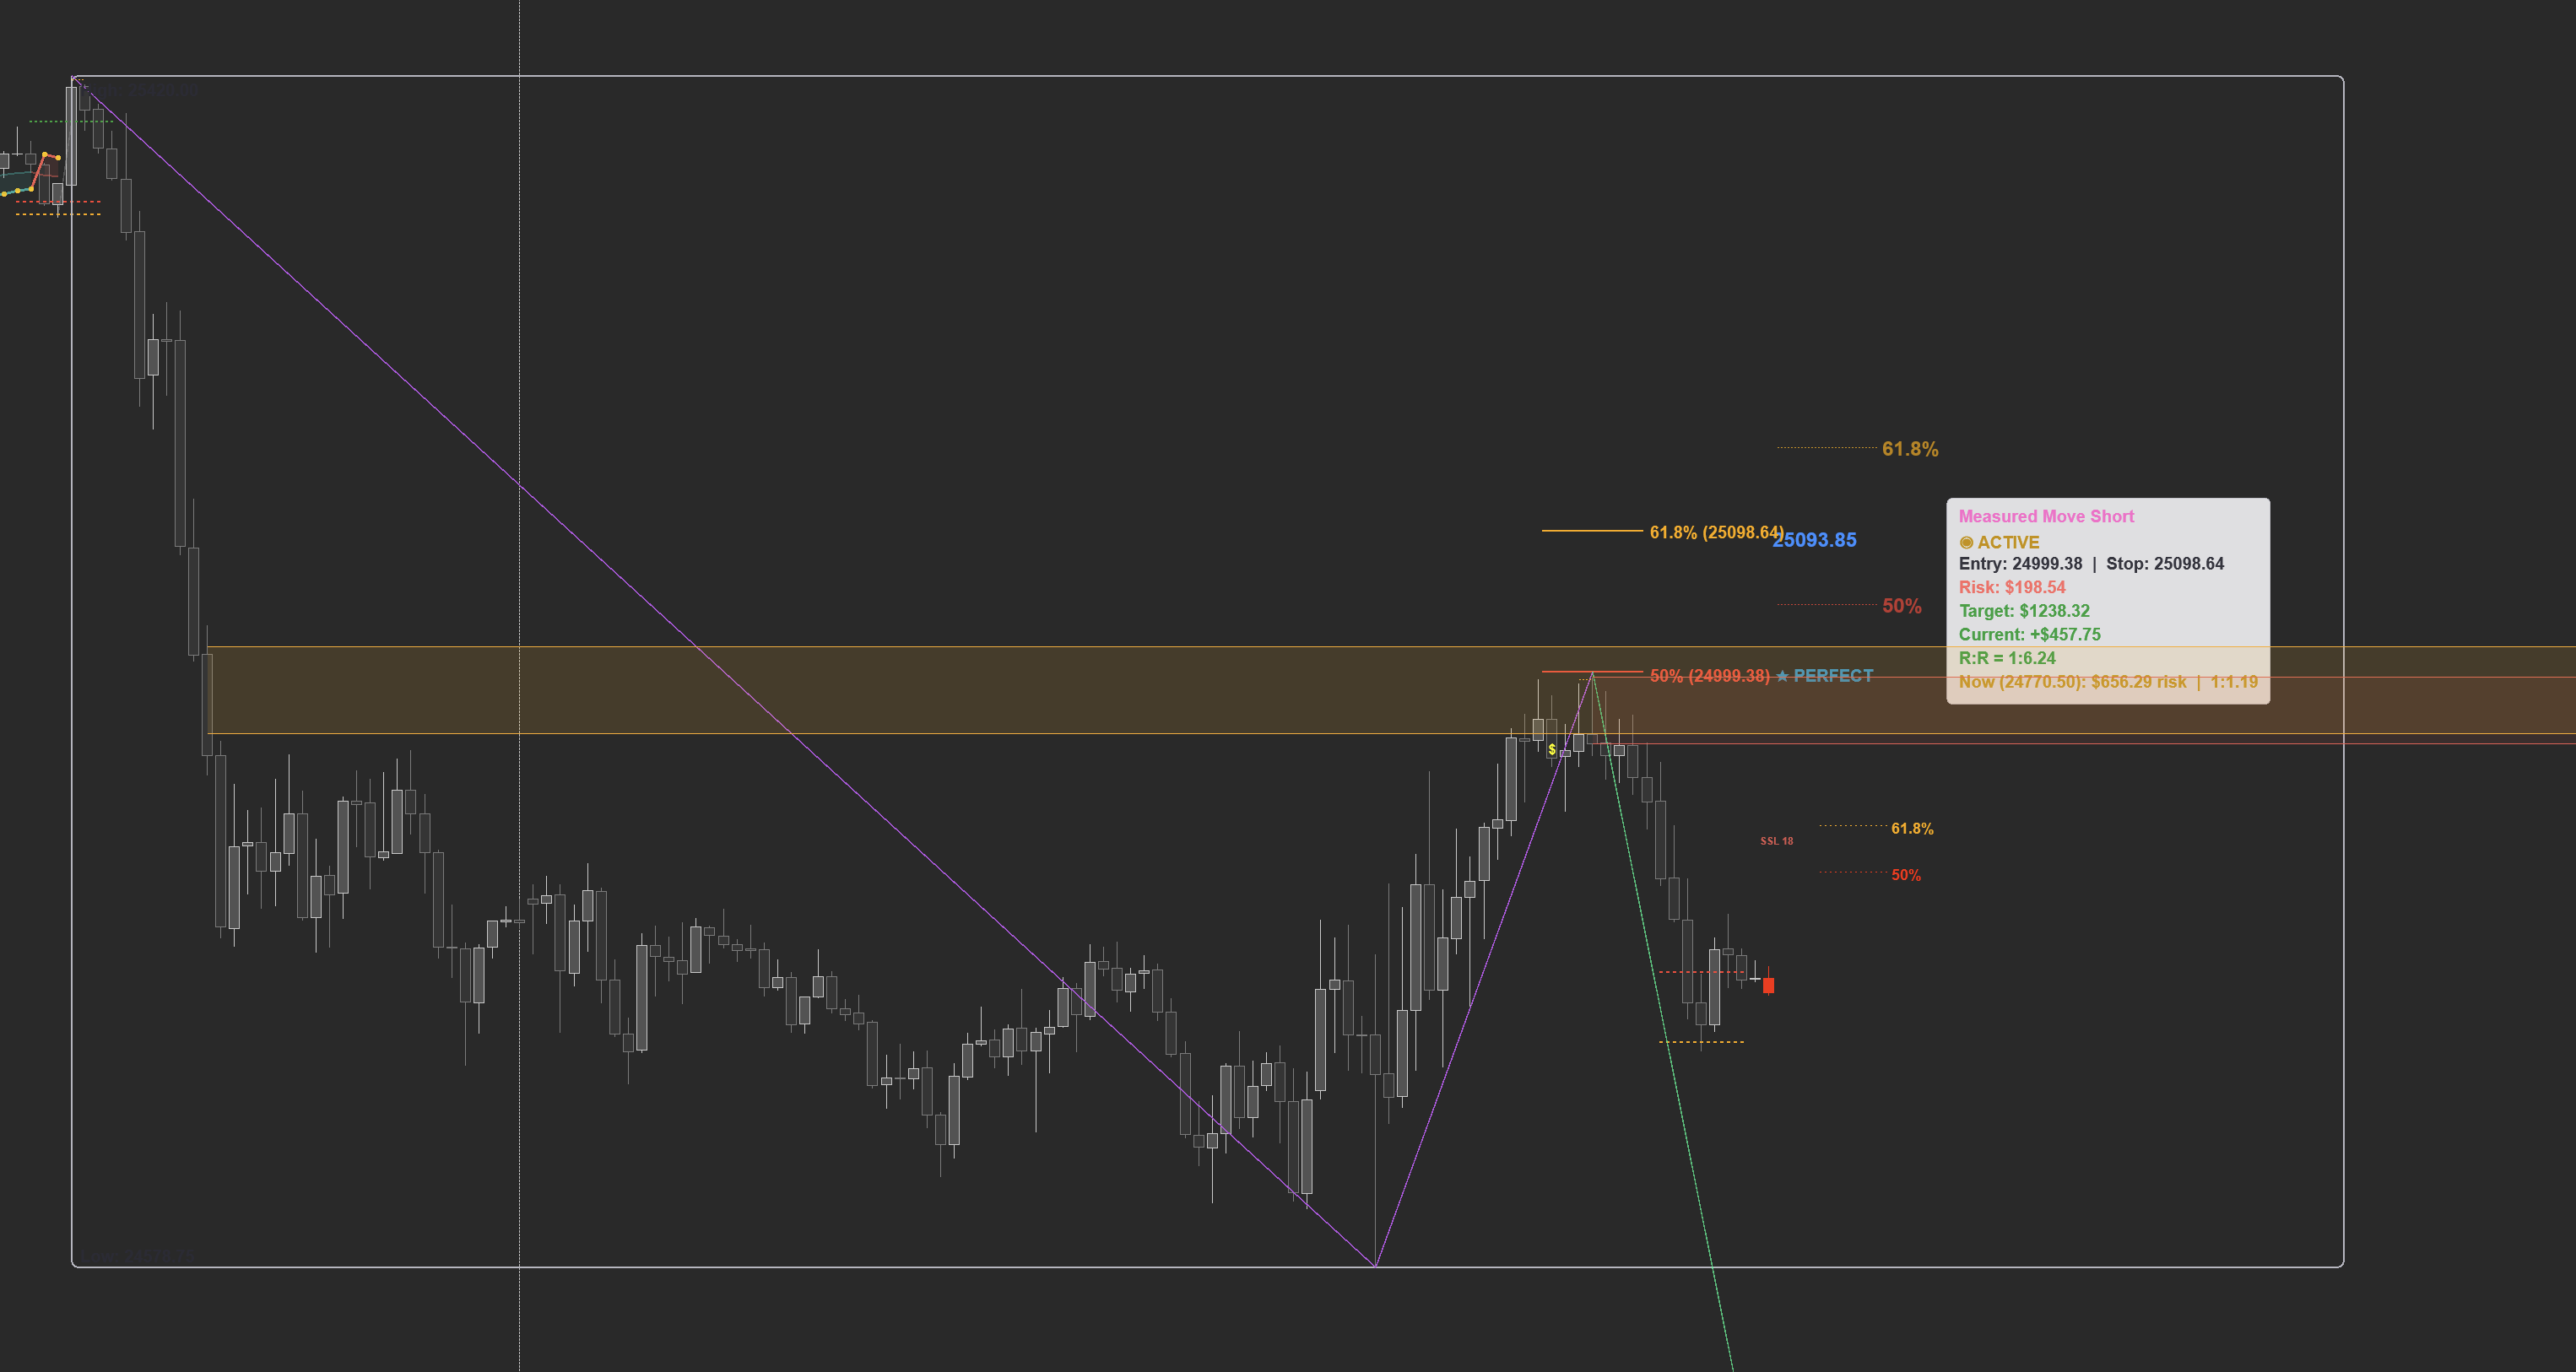
The entry was at 24999.38 with a stop at 25098.64 — a tight, defined risk with a target well below at the prior support zone.
That's not a gamble — that's a calculated trade with defined risk at a level where structure, fibs, and the measured moveDefinitionA price projection where Leg B equals Leg A. Primary target is the -23.6% extension beyond 100%. all converge.
The Lesson
This pattern repeats every single day across NQDefinitionE-mini Nasdaq 100 futures contract. Known for fast, volatile moves. 1 tick = $5, 1 point = $20., ESDefinitionE-mini S&P 500 futures contract. Tracks the S&P 500 index. 1 tick = $12.50, 1 point = $50. Most heavily traded index future., YMDefinitionE-mini Dow Jones futures contract. Less volatile than ES/NQ. 1 tick = $5, 1 point = $5., and every other futures contractDefinitionAn agreement to buy or sell something at a set price on a future date. The foundation of every futures trade.. The details change — the level is different, the time is different — but the structure is always the same:
Impulse move establishes direction. Price pushes into a key level but momentum dies — the squeezeDefinitionLow volatility compression — Bollinger Bands inside Keltner Channels. Expect an explosive move when it fires. starts. Retail sees the tight consolidation and thinks breakout. Smart money sees no momentum and fades the move at the measured moveDefinitionA price projection where Leg B equals Leg A. Primary target is the -23.6% extension beyond 100%. or fib level. Price reverses and the chasers get stopped out.
Key Insight
When a squeeze has no momentum behind it, it's not loading up for a breakout — it's running out of gas. That's your edge.
How to Trade This Instead
Here's what the professional approach looks like:
1. Identify the Measured Move Level Before It Gets There The indicator plots the 50% and 61.8% levels automatically. You know exactly where the trap is before price arrives.
2. Wait for Price to Reach the Level Don't anticipate. Don't front-run. Wait for price to actually touch the level.
3. Look for the Squeeze With No Momentum This is the tell. A squeeze at a key level is normal — but a squeeze with no momentum behind it? That's exhaustion. When the squeeze is barely pushing price higher and there's no follow-through, smart money is already positioning against it. Add a CHoCH on top of that and you have the highest probability reversal setup in futures trading. All three signals aligned today on NQ.
4. Enter With a Tight Stop Your stop goes just above the measured move level. Risk is tiny. Target is the prior low or the next support zone.
The Numbers Don't Lie
When the risk is tight and the target is multiple R away, the math works in your favor. You can be wrong multiple times in a row and one winner still puts you net positive.
Key Insight
That's the edge. Not a 90% win rate — a risk-to-reward ratio that makes the math work even with a 30% win rate.
Compare that to the trader who bought the squeezeDefinitionLow volatility compression — Bollinger Bands inside Keltner Channels. Expect an explosive move when it fires. at the highs: wide stop, compressed target, inverted risk-to-reward. Even if they're right 60% of the time, they're still losing money.
Dropping to the 1-Minute: Ninja Entries
The 15-minute gave us the big picture. But for traders who want surgical precision, the 1-minute chart was firing measured movesDefinitionA price projection where Leg B equals Leg A. Primary target is the -23.6% extension beyond 100%. all session. These were tiny, fast trades — and you had to be a ninja to get into them.
Early in the session, a long measured moveDefinitionA price projection where Leg B equals Leg A. Primary target is the -23.6% extension beyond 100%. set up off the initial structure. The BOSDefinitionBreak of Structure — price breaks the previous swing point in the trend direction. Confirms continuation. confirmed bullish, the CHoCHDefinitionChange of Character — the first warning a trend may be ending. Price breaks a swing point against the trend. printed on the lows, and the 50% level gave a clean entry for the move back up to the highs. That was the easy one.
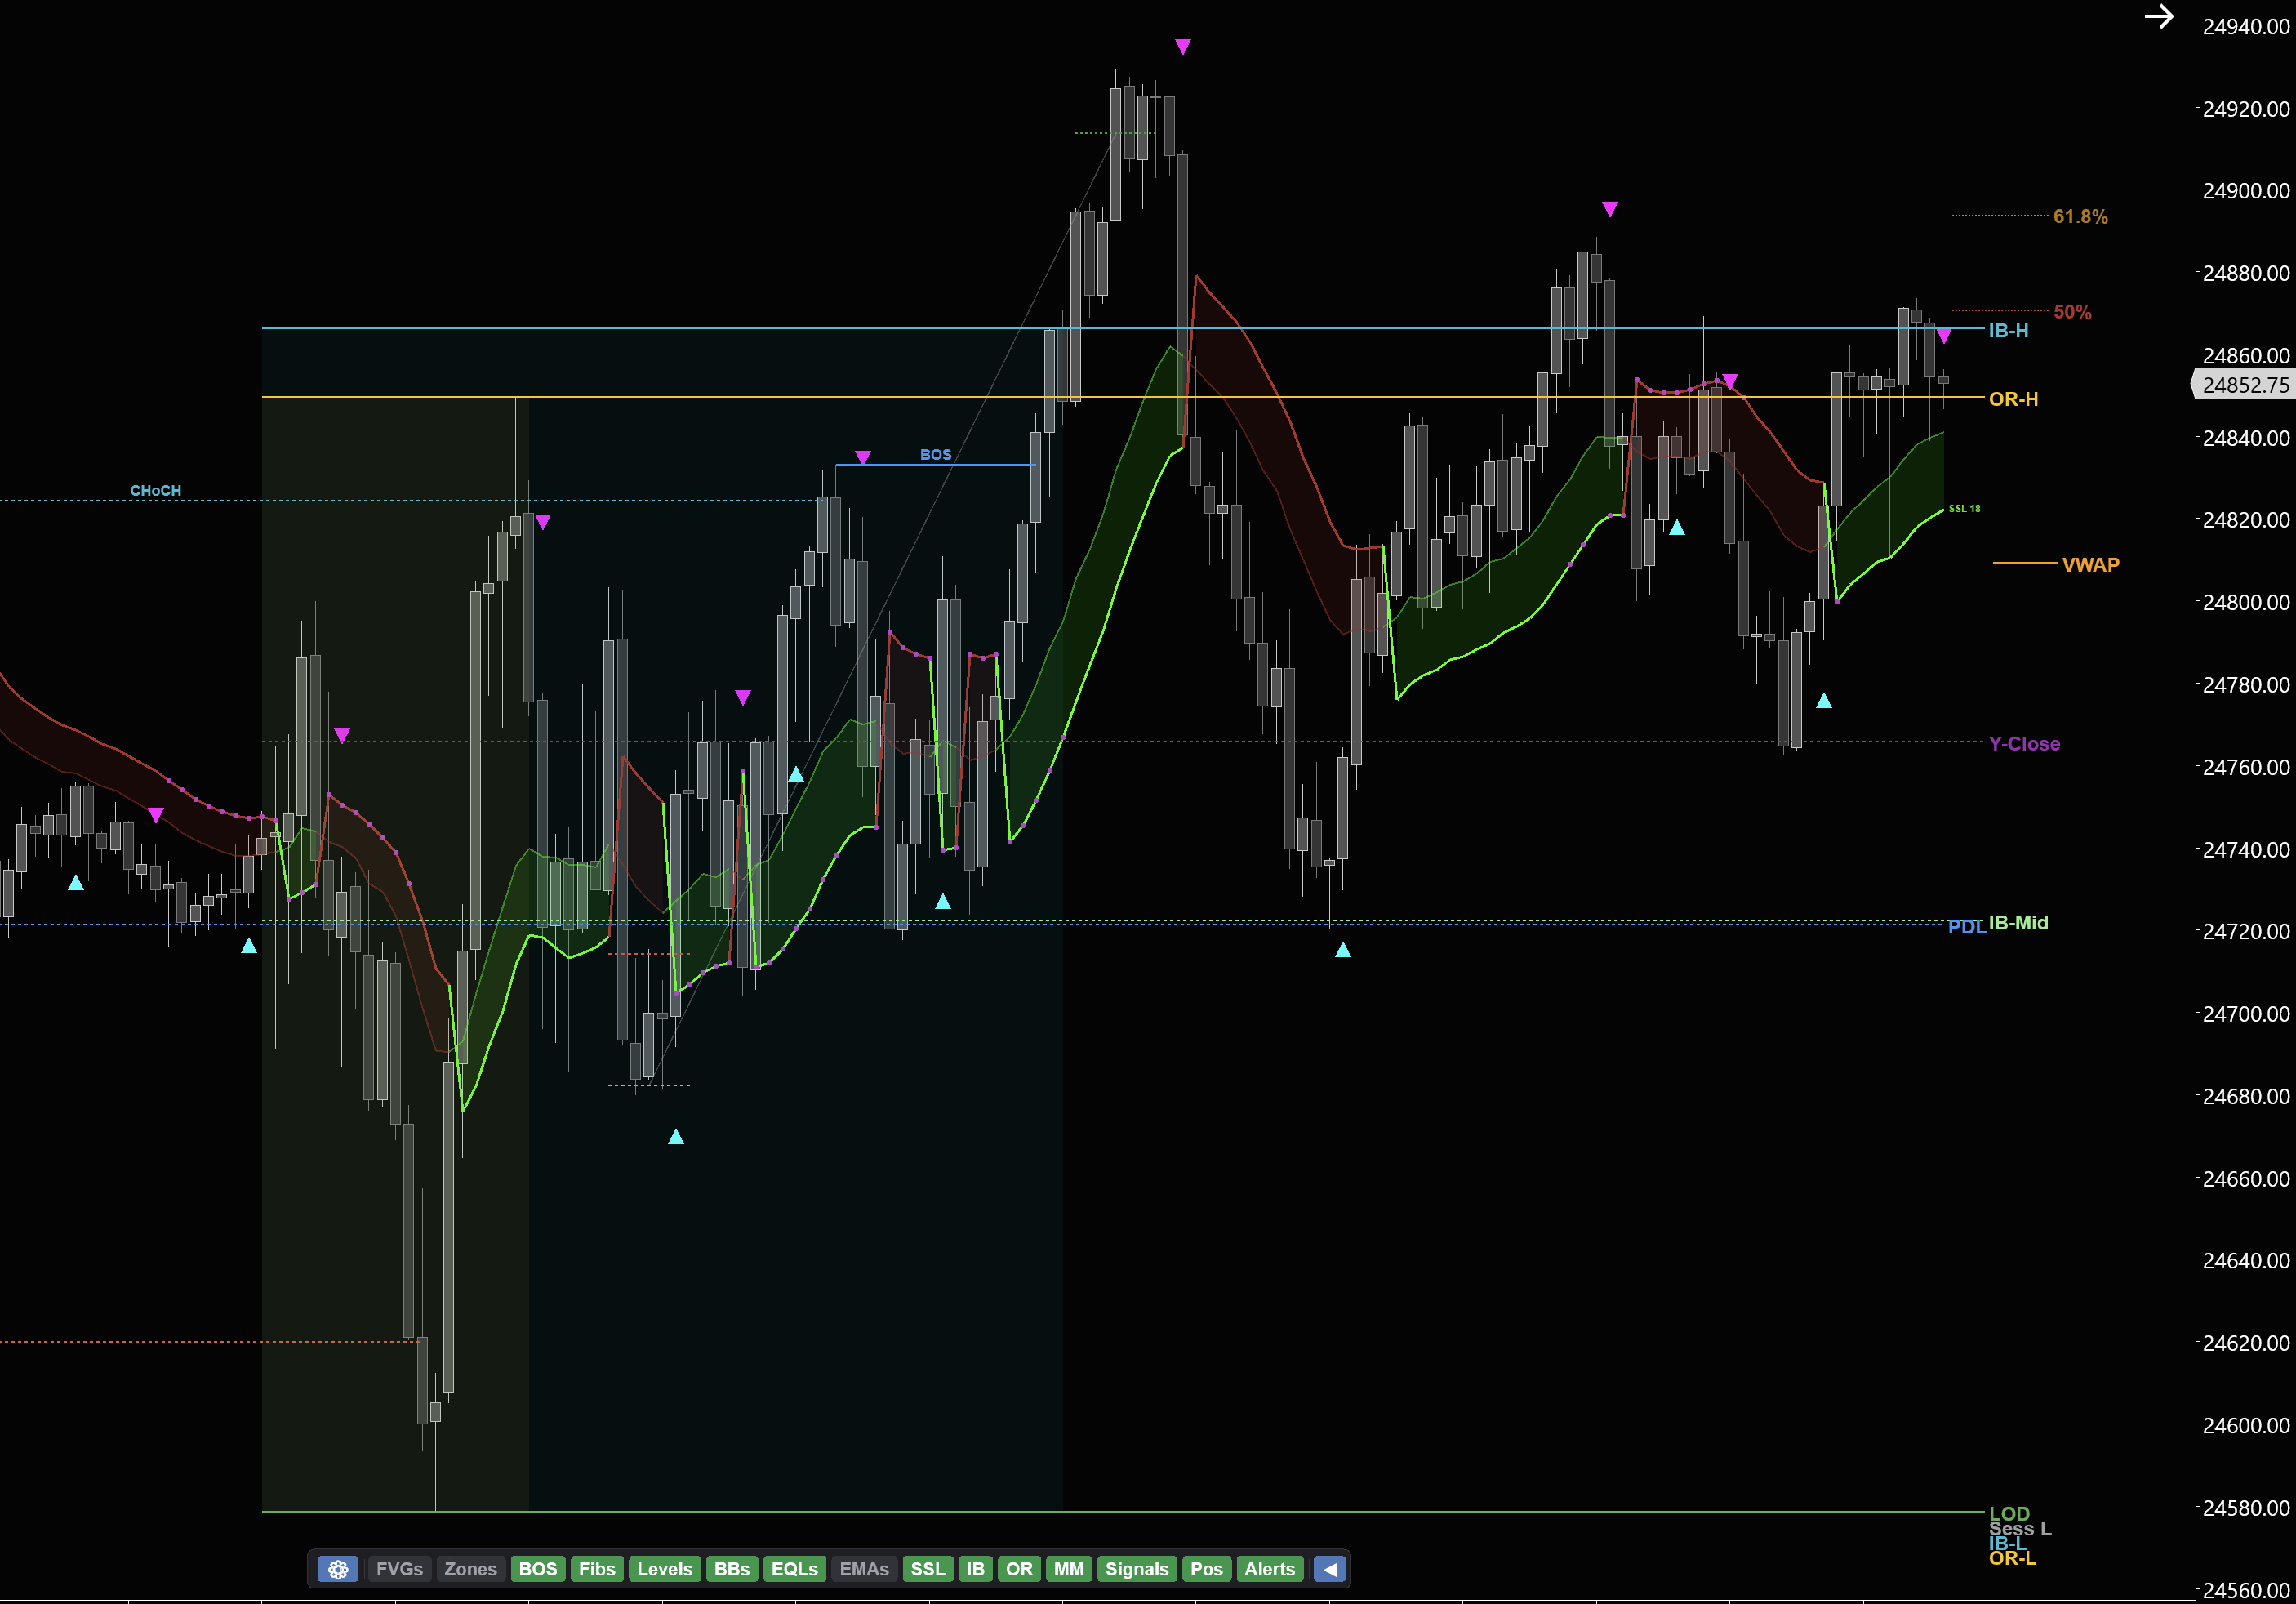
But the real action came after NQDefinitionE-mini Nasdaq 100 futures contract. Known for fast, volatile moves. 1 tick = $5, 1 point = $20. hit that 15-minute 50% level and reversed. Once the structure flipped bearish on the 1-minute, it was short after short after short. A series of measured moveDefinitionA price projection where Leg B equals Leg A. Primary target is the -23.6% extension beyond 100%. shorts stacked up as sellers piled on — each one with a tight stop above the prior swing highDefinitionA peak on the chart where price reversed lower. Marks where sellers previously overpowered buyers. and a target at the next support.
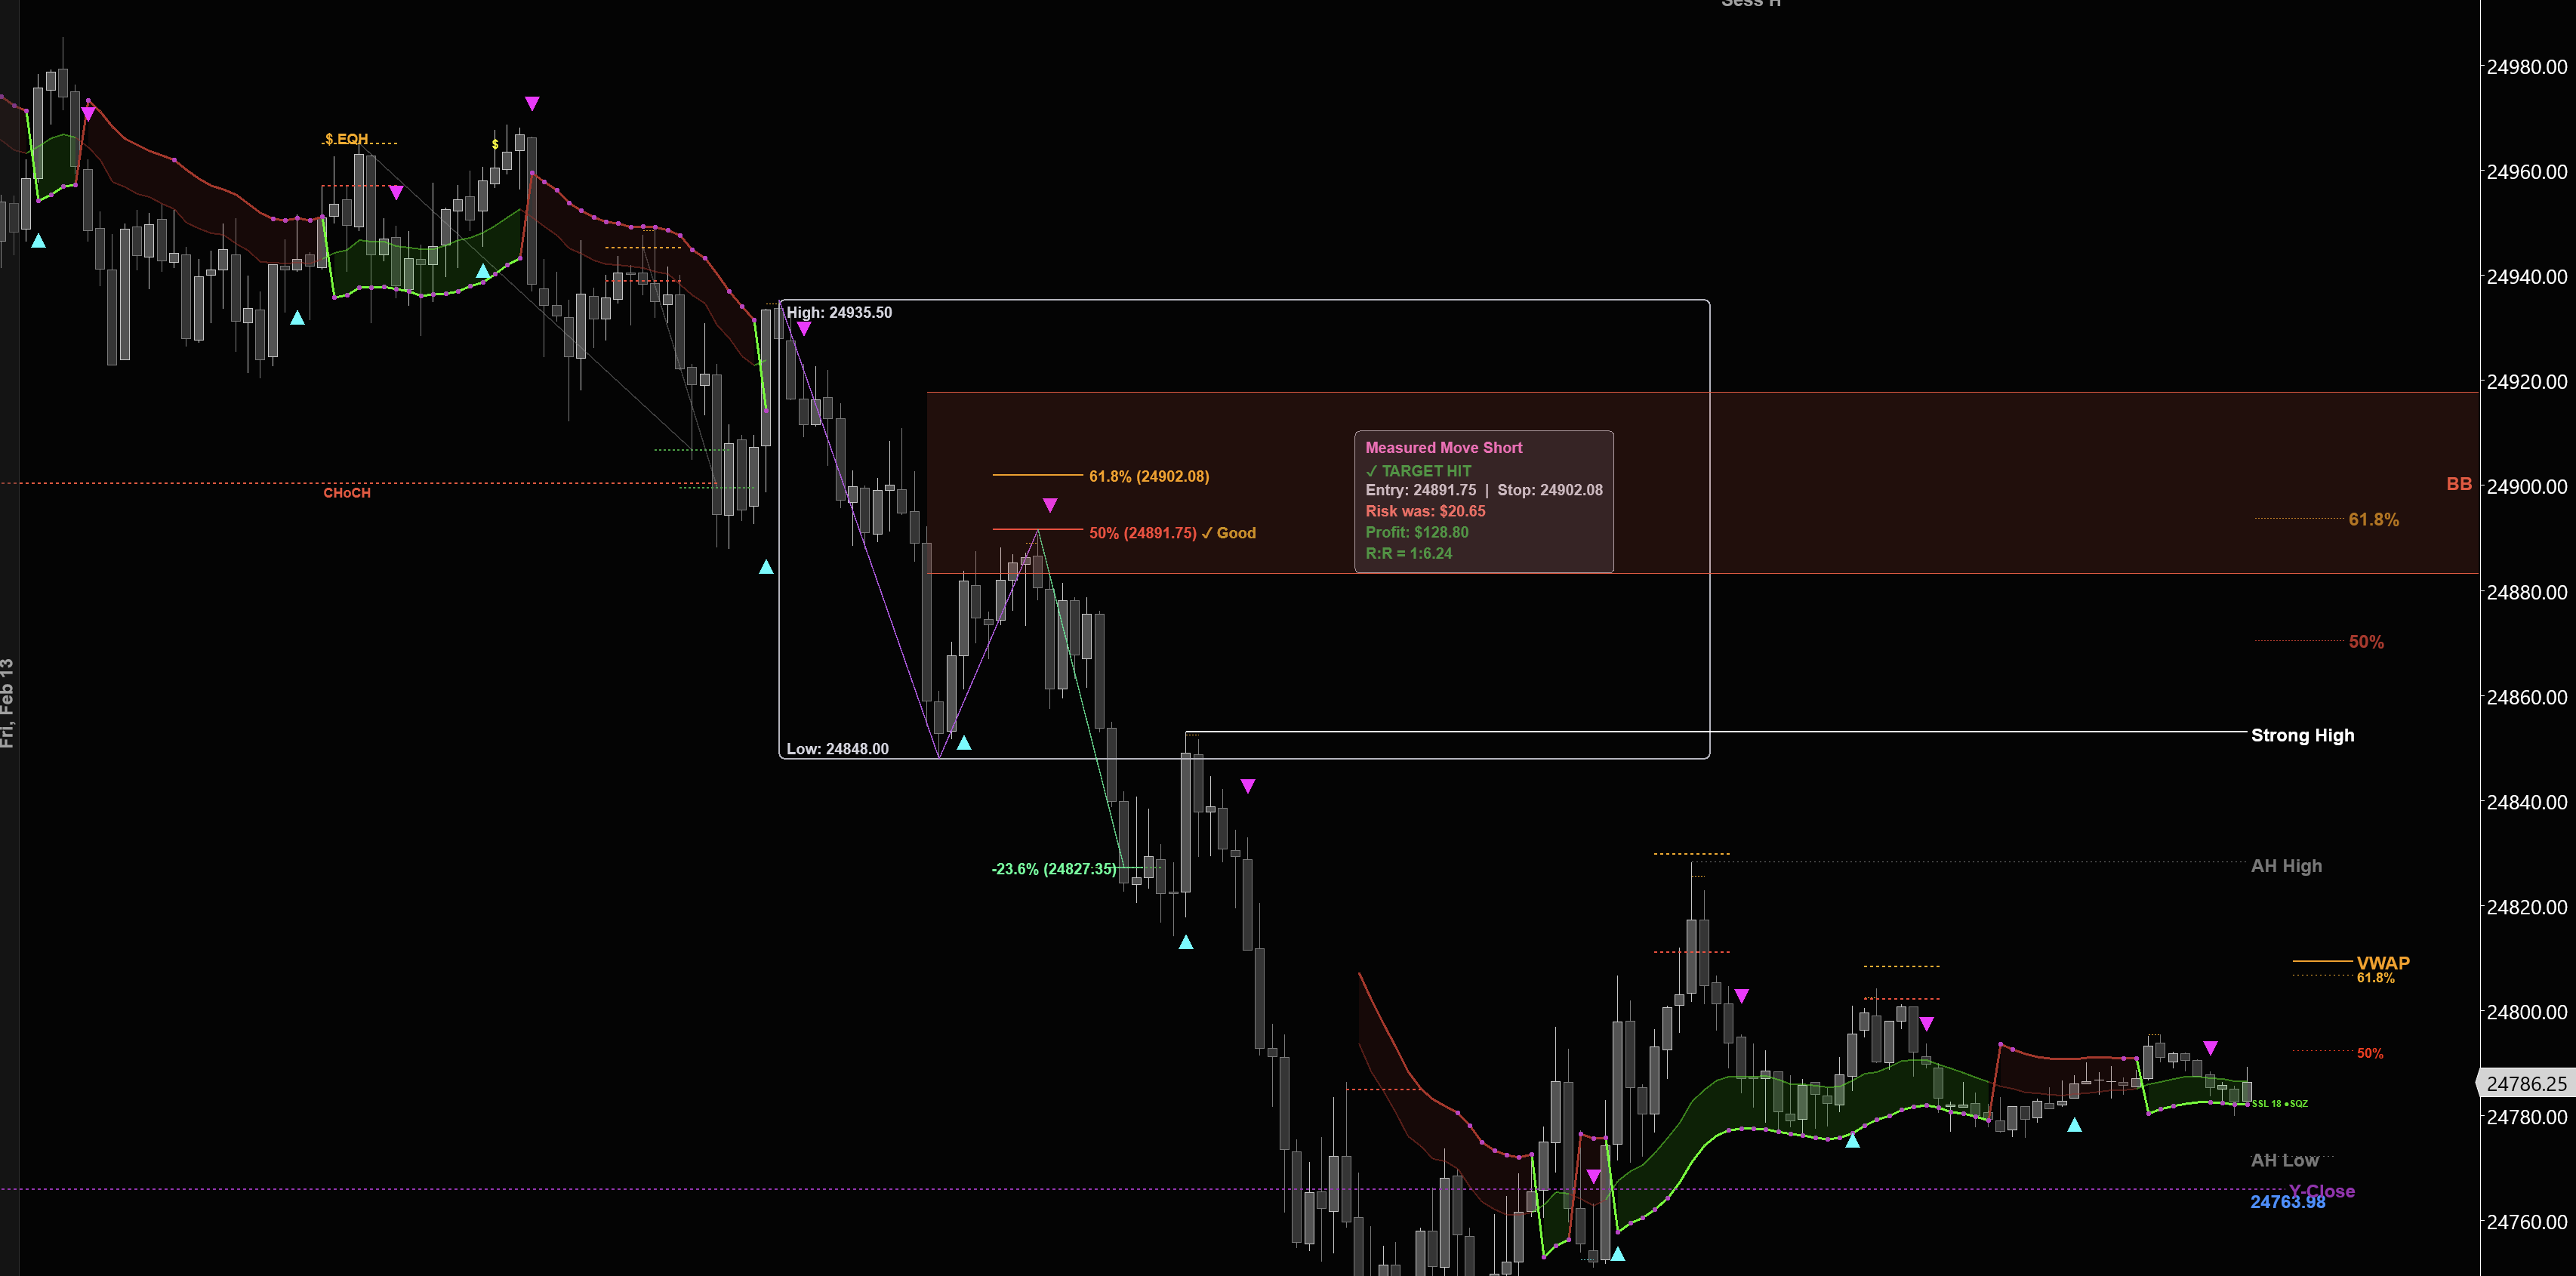
Look at that execution: entry at 24891.75, stop at 24902.08. A tight stop with a clean target at the next support level. Target hit, no heat, no stress.
Key Insight
The 15-minute tells you where to look. The 1-minute tells you when to pull the trigger. The measured move gives you the exact entry, stop, and target before you even click the button.
These aren't trades you can hesitate on. By the time you see the setup forming, the entry is seconds away. You need the levels pre-plotted on your chart so all you're doing is executing — not calculating, not drawing lines, not second-guessing.
Key Takeaway
Today's NQDefinitionE-mini Nasdaq 100 futures contract. Known for fast, volatile moves. 1 tick = $5, 1 point = $20. was a masterclass in why you don't chase squeezes into resistance. The 50% measured moveDefinitionA price projection where Leg B equals Leg A. Primary target is the -23.6% extension beyond 100%. short was sitting right there — plotted on the chart before price even arrived. All you had to do was wait.
Key Insight
The best trades are the ones you see coming. Structure first. Level second. Confirmation third. Execution last.