Structure. Levels. Signals.
BOS, CHoCH, Measured Moves, FVGs, Order Blocks, Squeeze, EMAs, Key Levels, and Alerts — all in one NinjaTrader 8 indicator.
Version 1.0.55·Released
No credit card required. Full access for 5 days.
Features
What's Included
One indicator with everything you need — structure, volume, zones, squeeze, and more.
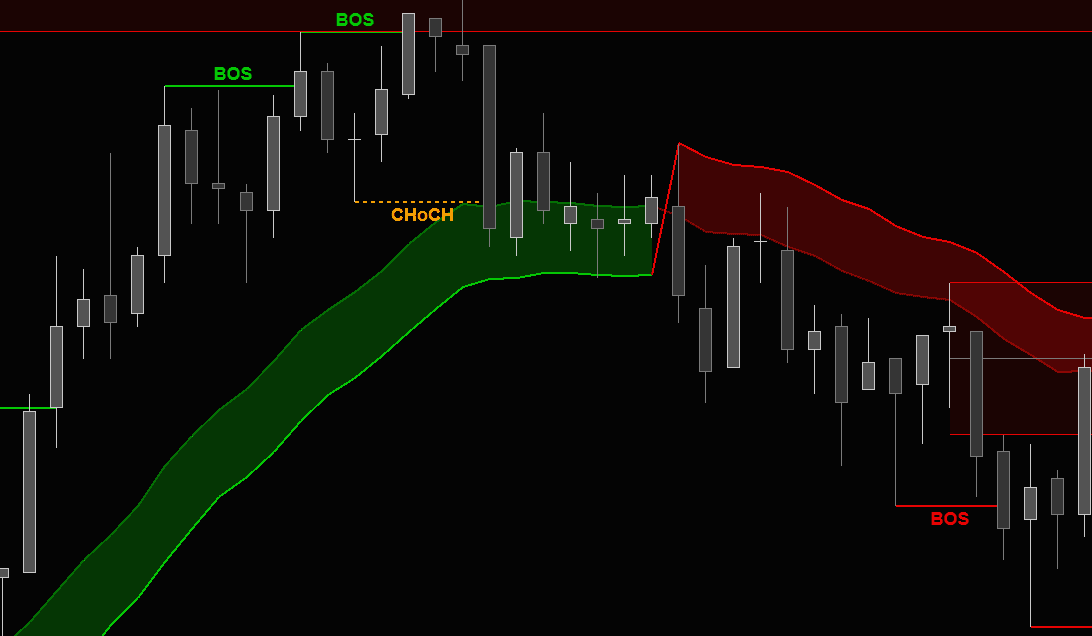
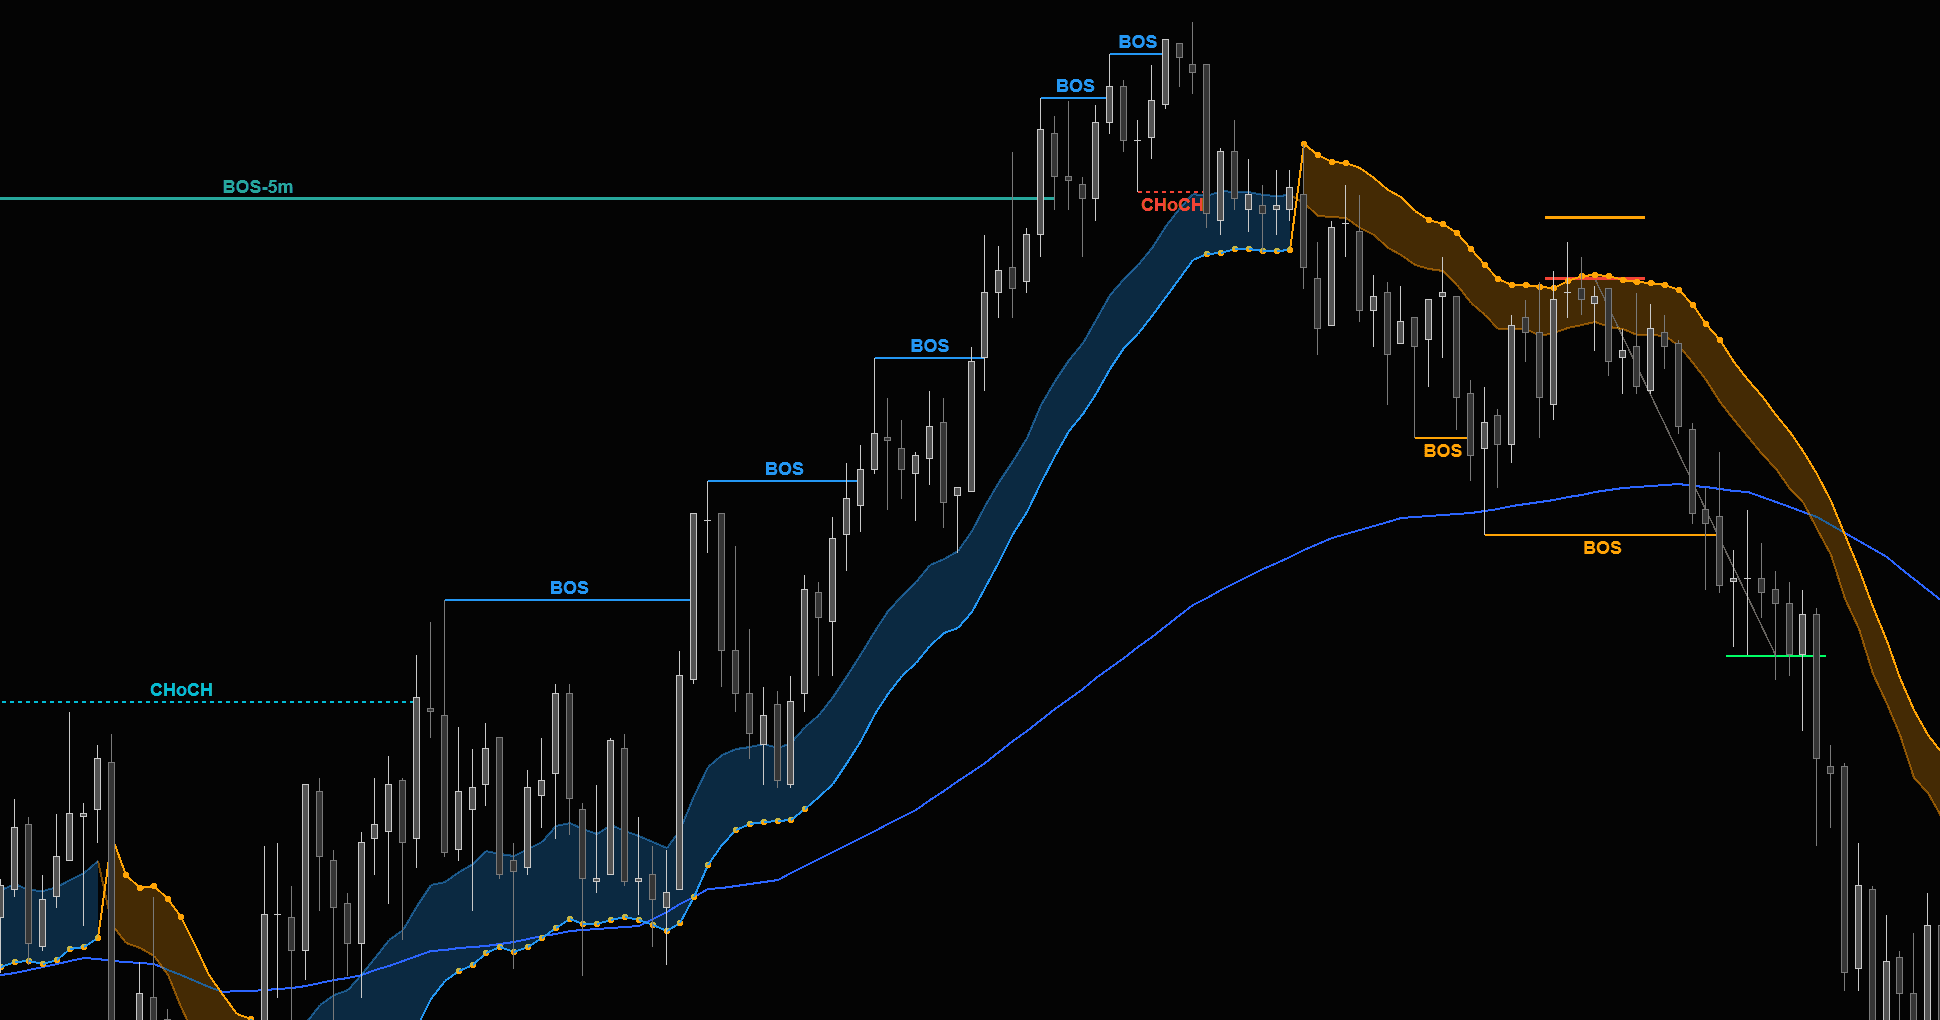
BOS & CHoCH Detection
Automatic Break of Structure and Change of Character labels in real-time. Never miss a trend shift or reversal.
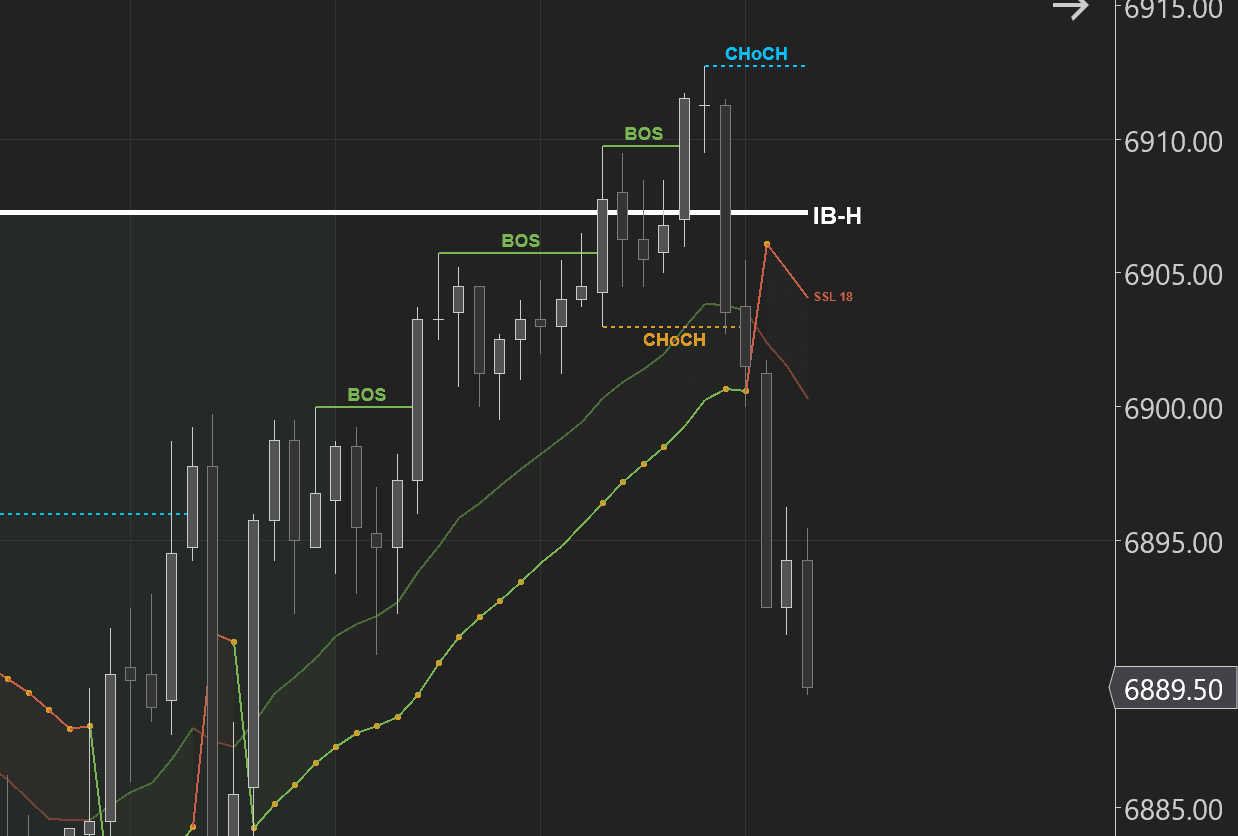
Opening Range & Initial Balance
Auto-plots OR and IB levels every session. Know the key zones before price even gets there.
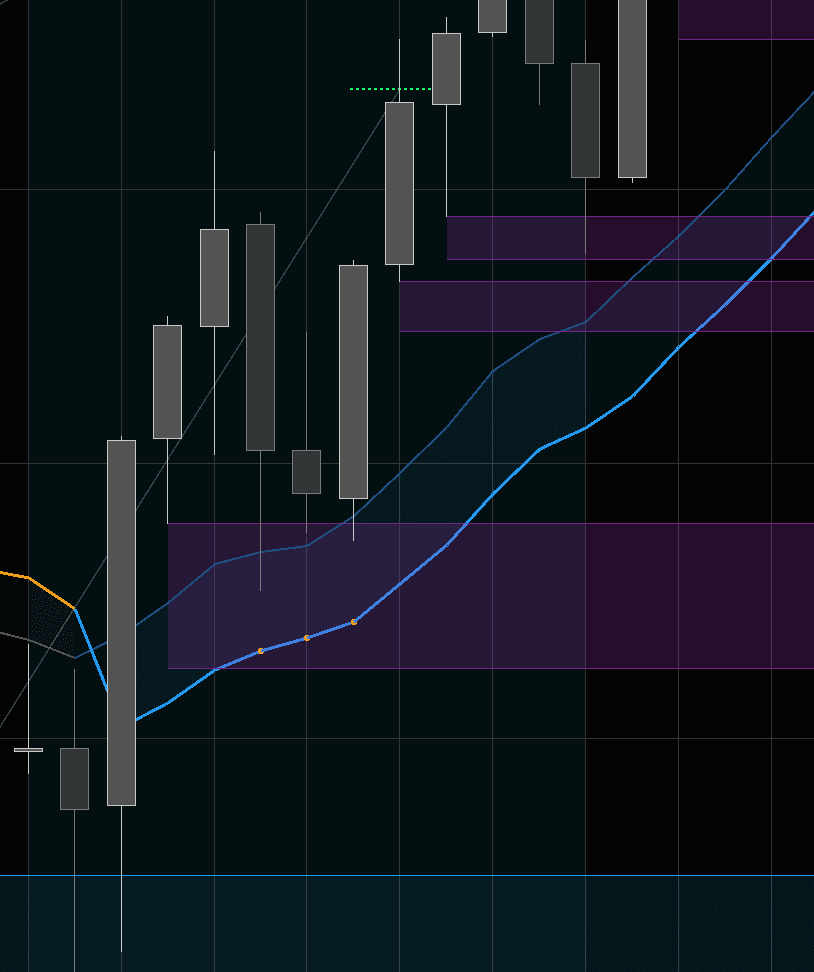
EMAs & SSL Channel
Built-in EMAs and SSL Channel with full customization. Trend direction at a glance, no extra indicators needed.
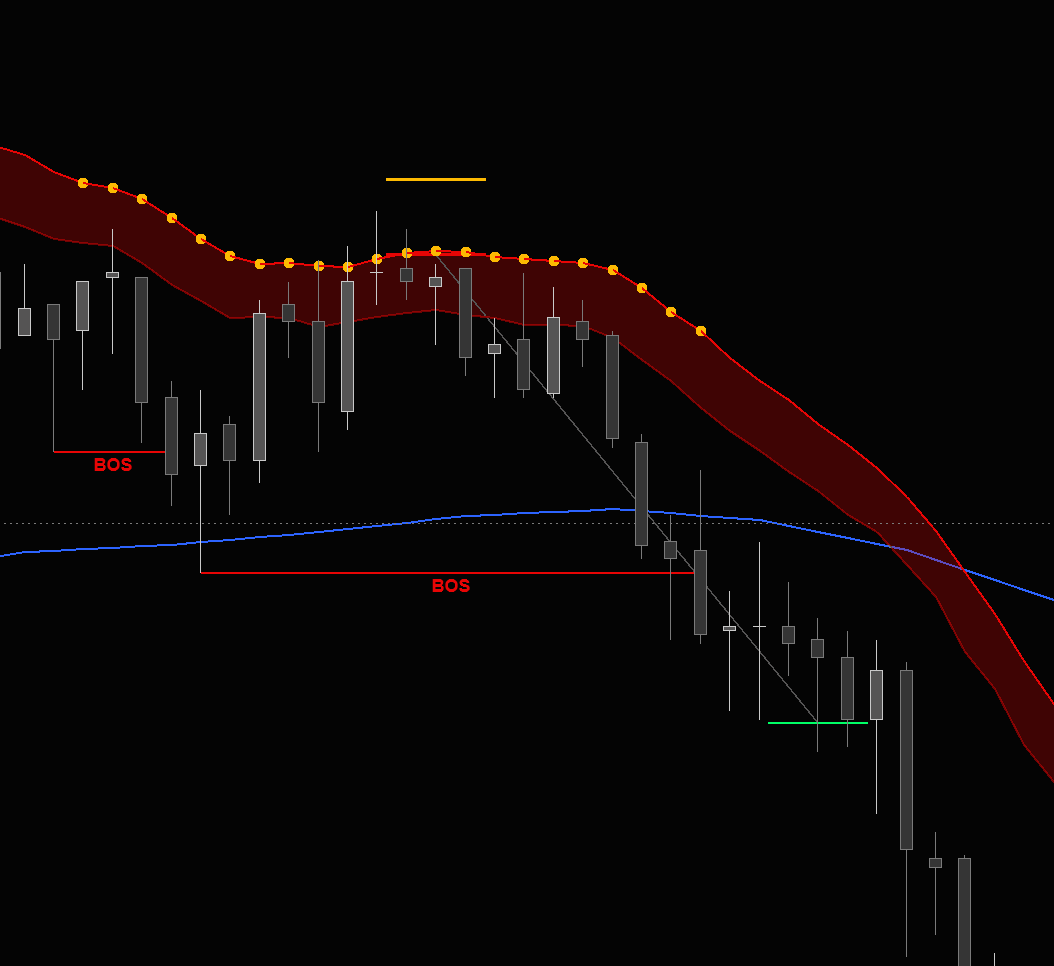
Squeeze Momentum
Integrated Squeeze shows when volatility is compressing and ready to explode. Spot breakouts before they happen.
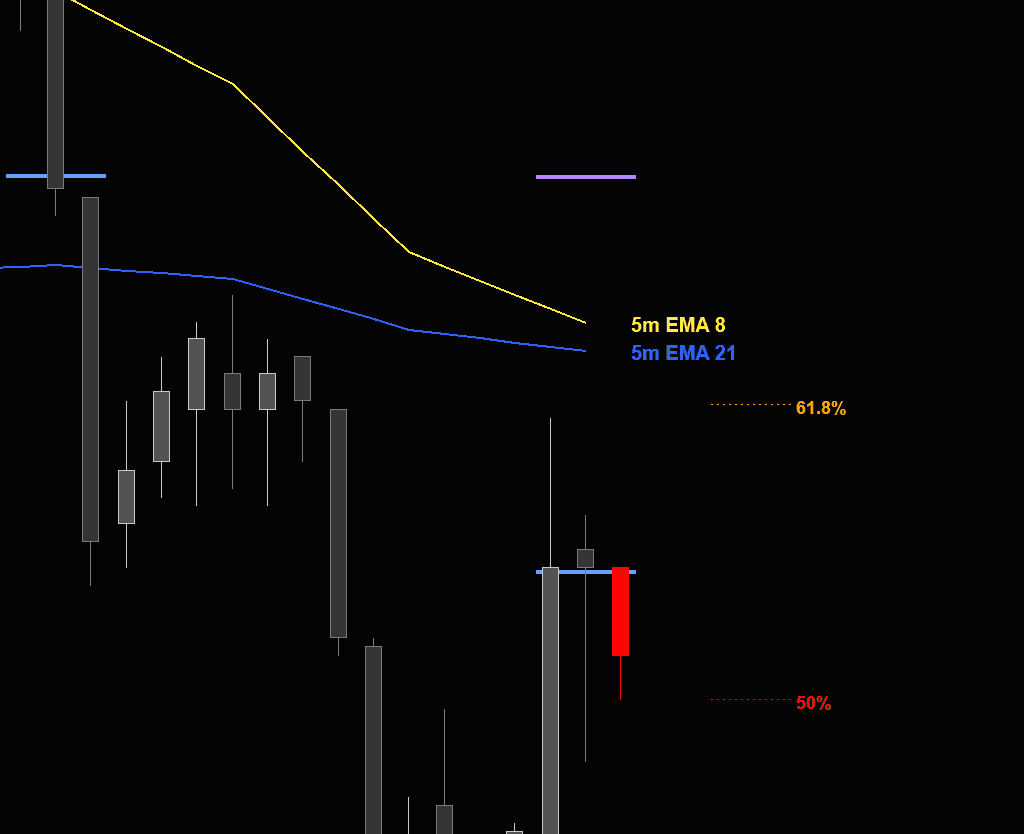
Multi-Timeframe EMAs
Plot EMAs from any timeframe directly on your chart. See the 5m, 15m, or hourly EMAs without switching charts.
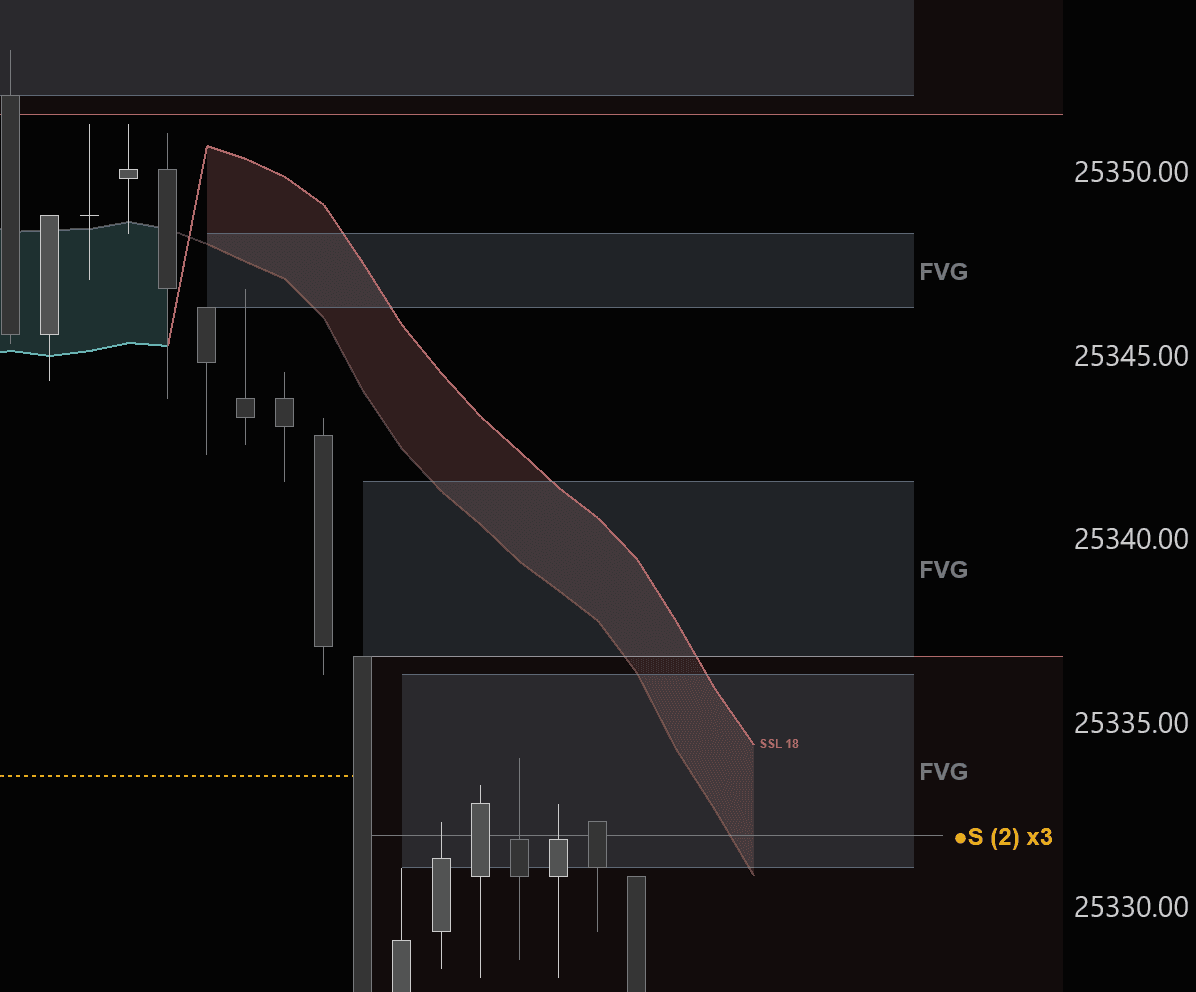
FVGs & Order Blocks
Automatic Fair Value Gap and Order Block zone mapping. See where institutional players are positioned.
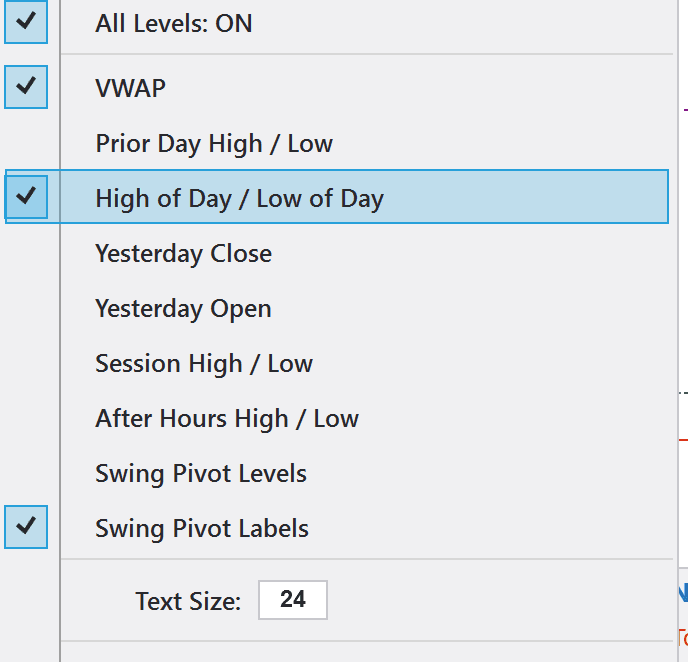
Key Levels & VWAP
VWAP, prior day high/low, session levels, swing pivots — all auto-plotted with full color and style customization.
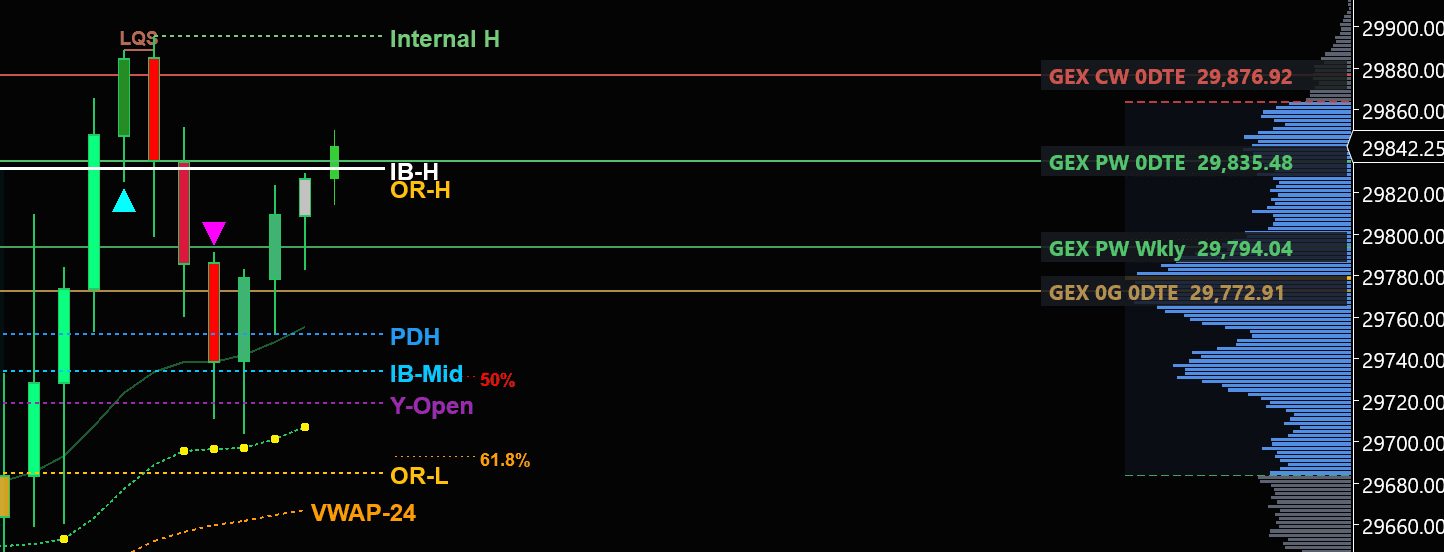
Gamma Exposure (GEX)
Live options-dealer positioning drawn on your ES and NQ chart. Call/Put walls, zero-gamma flip, and 15-min auto-refresh from the index options chain.
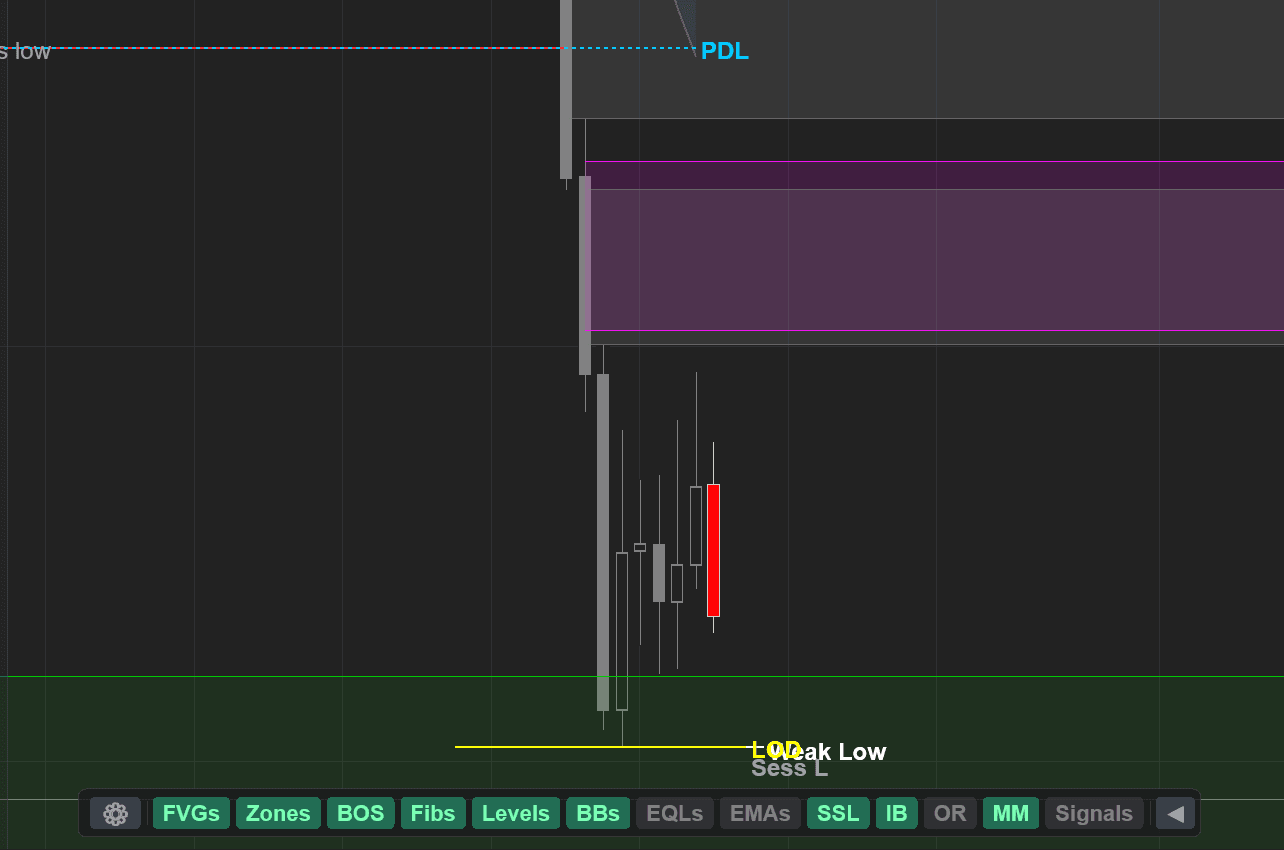
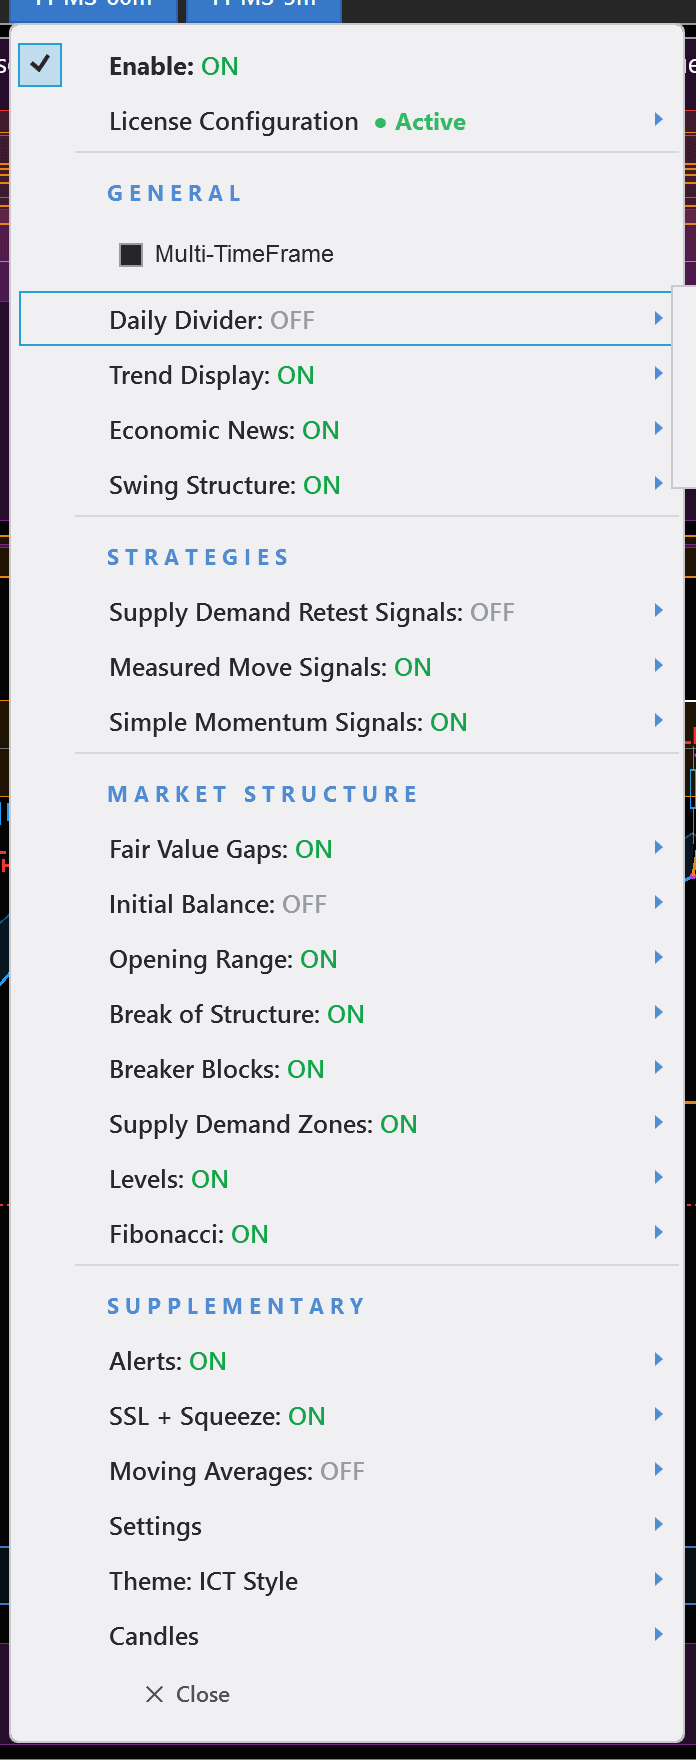
All-In-One Settings Menu
One indicator replaces 6+. Every feature toggled from a single organized menu — no more digging through NinjaTrader's clunky property grids.
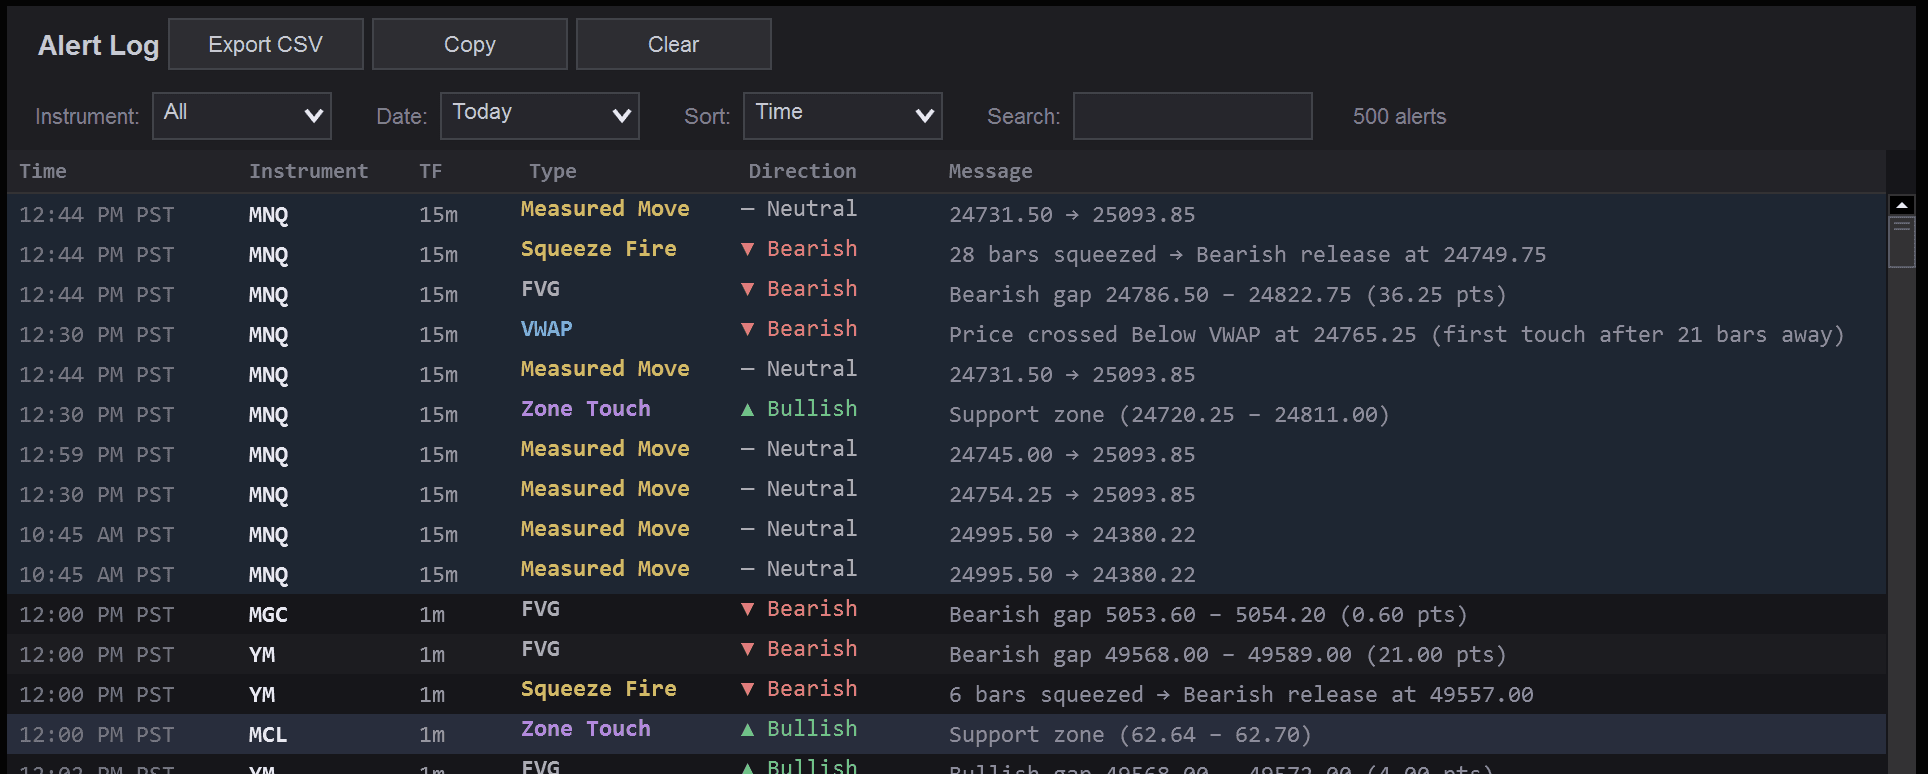
Real-Time Alert Log
Centralized alert dashboard tracks BOS, CHoCH, zone touches, squeeze fires, and more across all instruments and timeframes.
Auto Light & Dark Mode
Menu and panels automatically adapt to your NinjaTrader theme. Clean light mode for bright setups, dark mode for night trading.
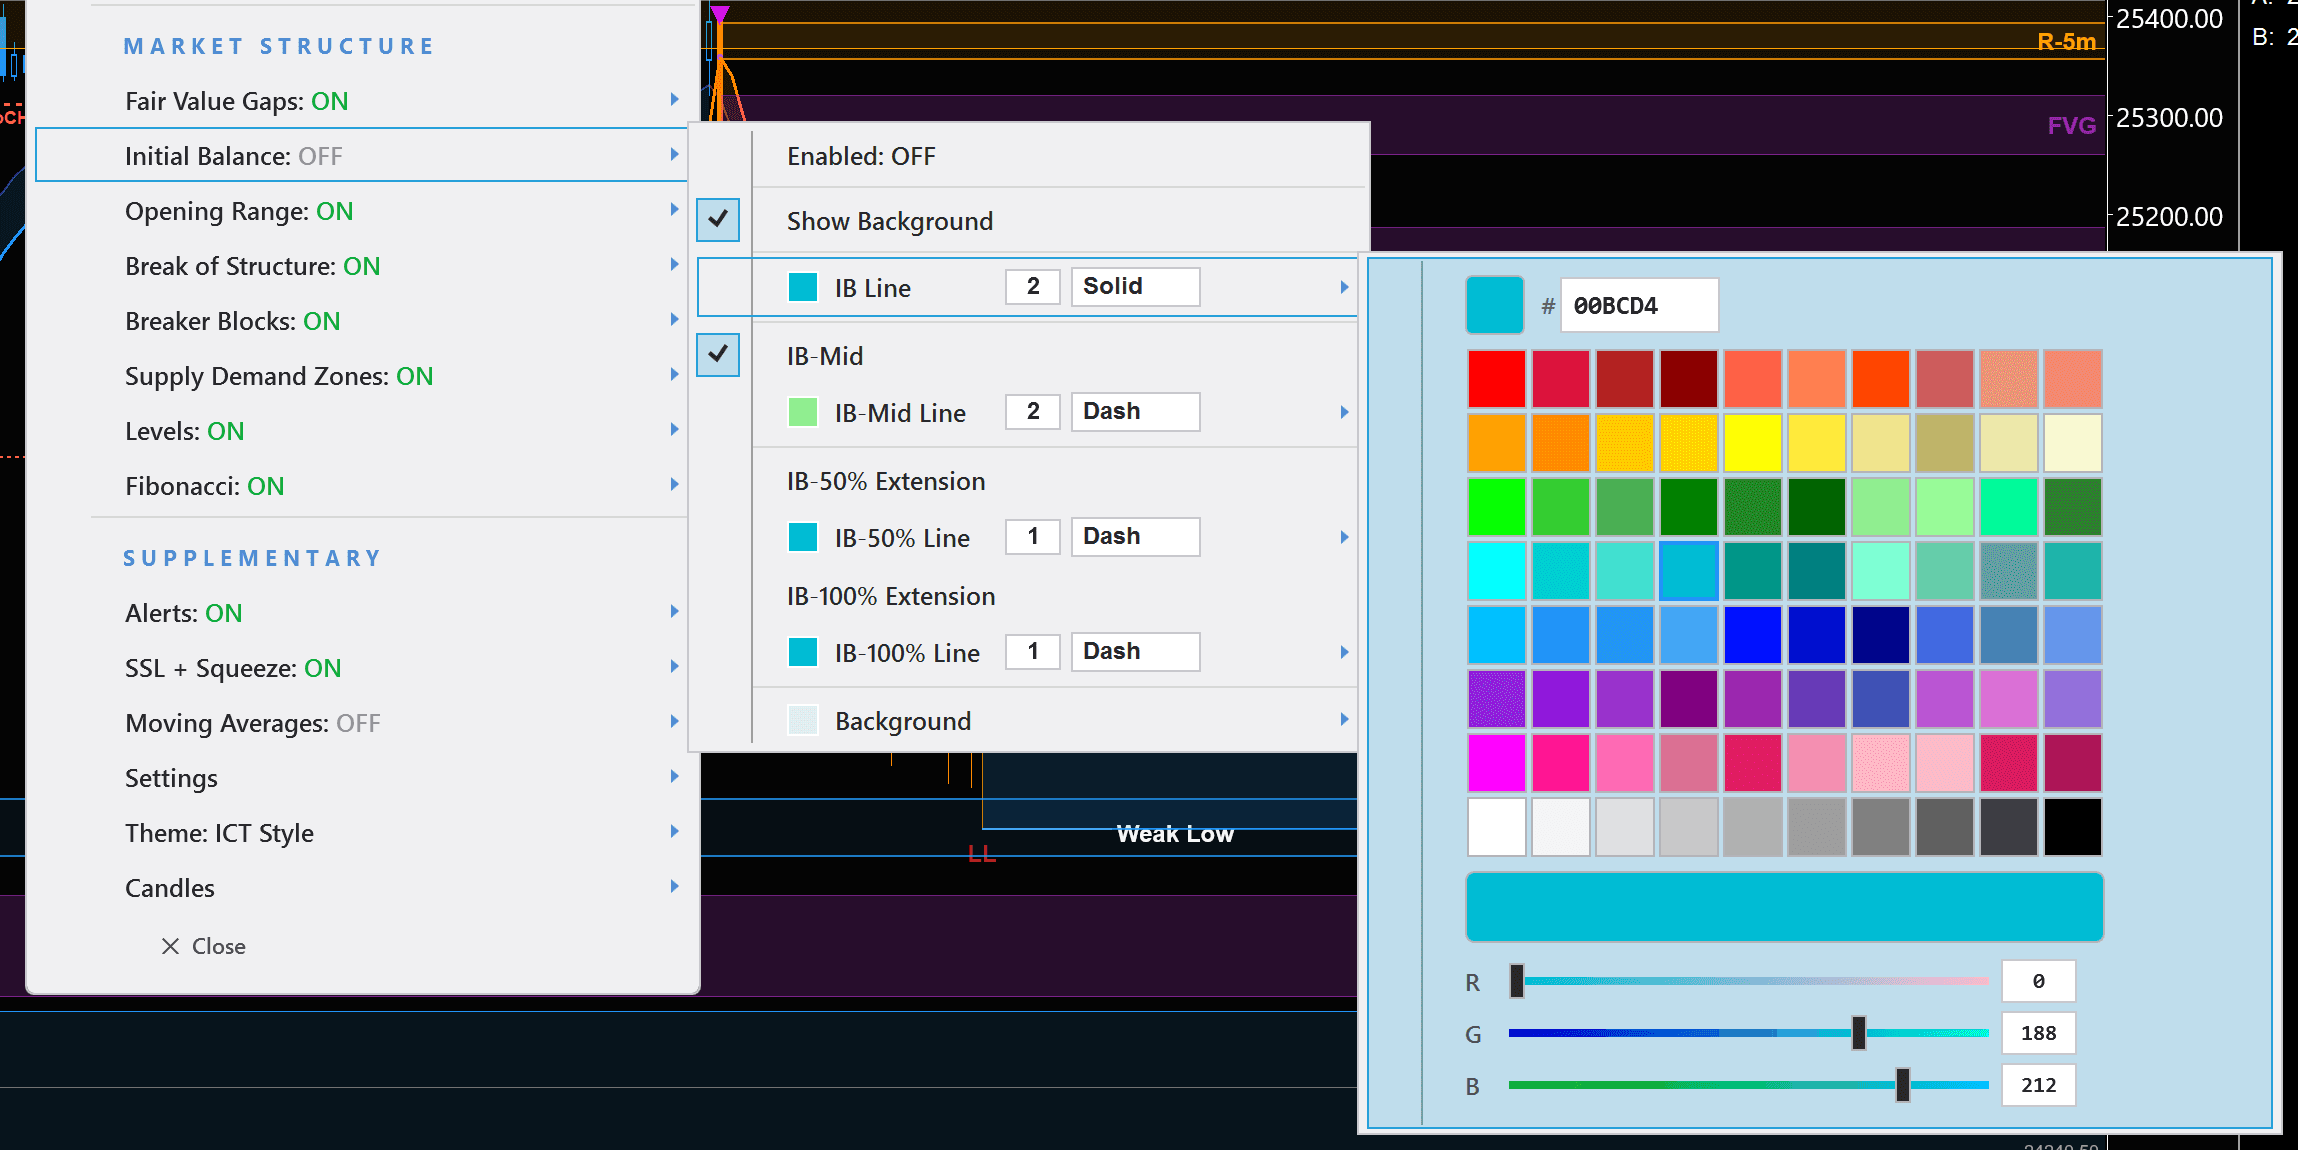
Full Color Customization
80-color swatch palette, hex input, and RGB sliders for every element. Make the indicator match your exact style.
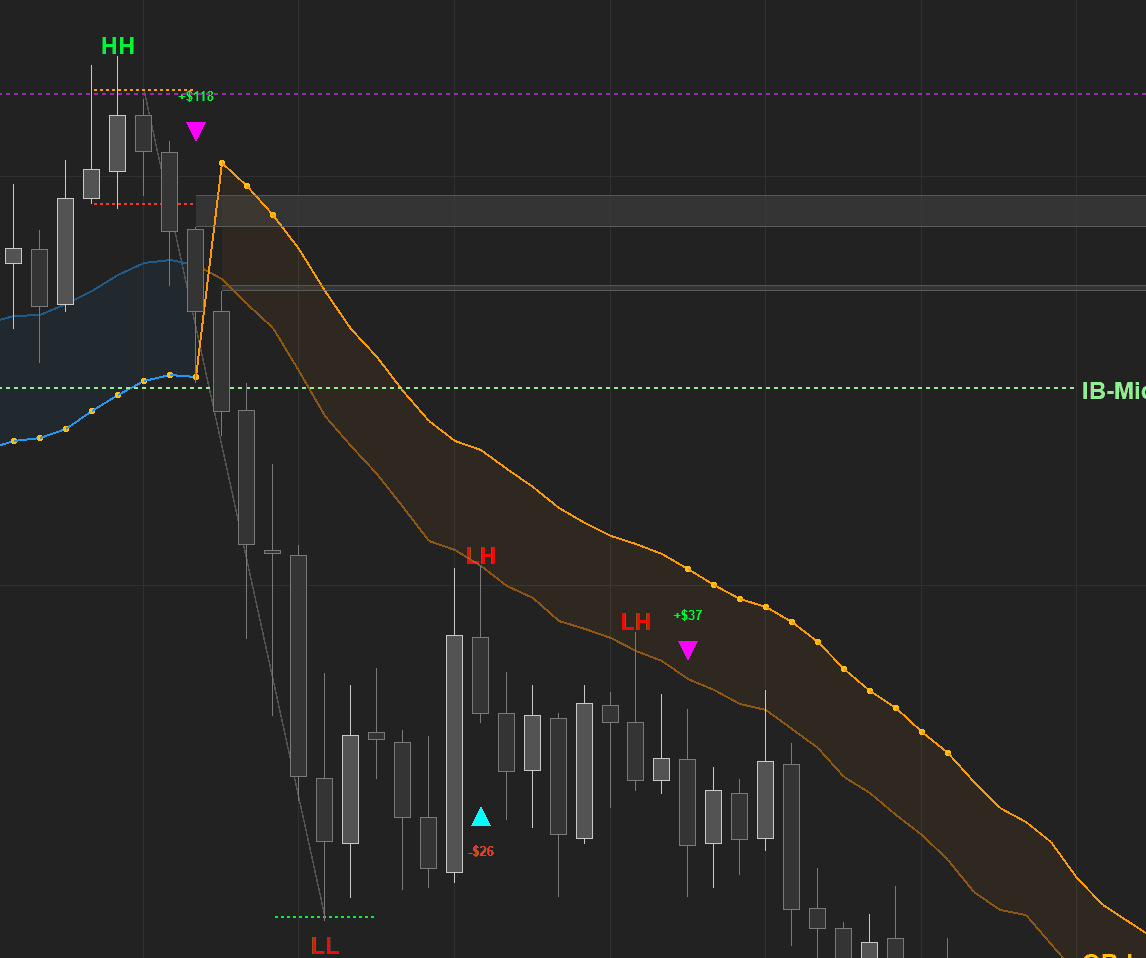
Buy & Sell Signals
Supply/demand retest and momentum-based signals with customizable colors and shapes. Clear entries and exits on every chart.
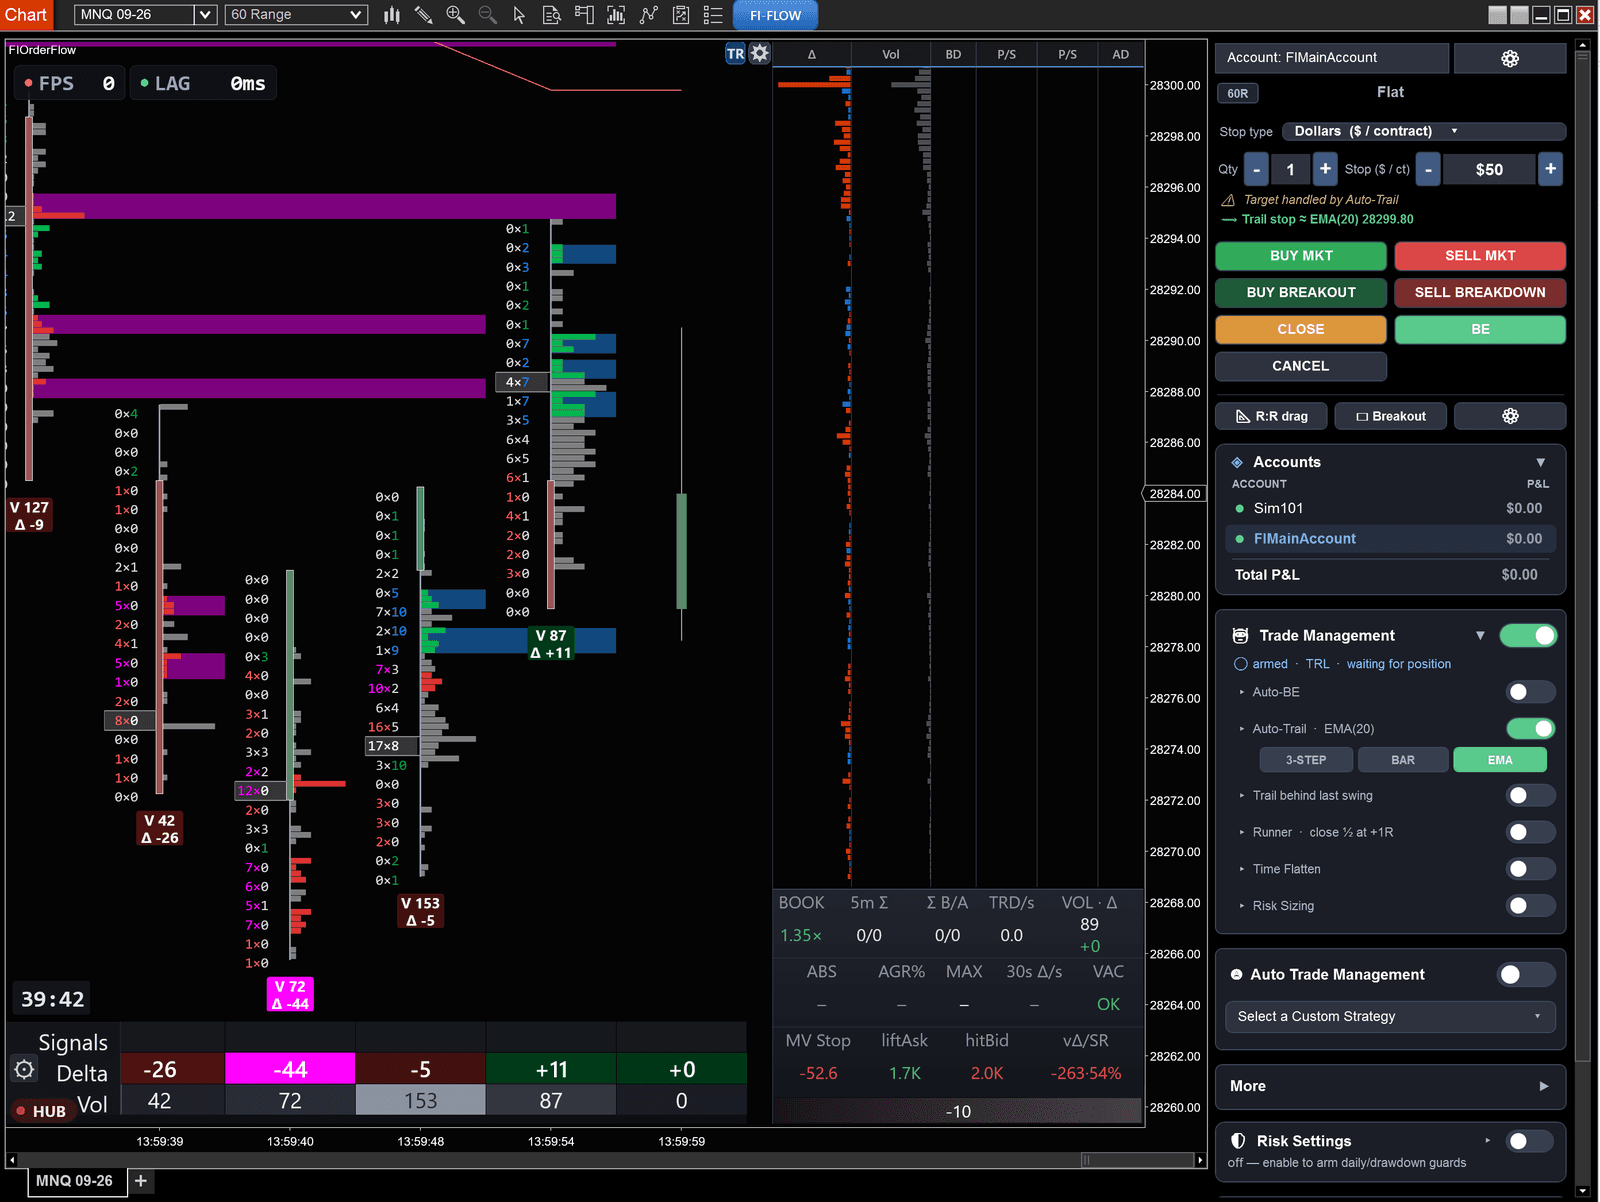
Auto Trade Management
Load a saved NinjaTrader ATM template and the panel runs the trade end-to-end — multi-target scale-outs, auto-breakeven, and multi-step trailing stops, all hands-off once you're filled.
See It In Action
Indicator Overview & Trade Review
A walkthrough of the Market Structure Indicator's core features and a review of real trades — BOS, CHoCH, measured moves, and squeeze setups.
Light & Dark Mode
Your Chart, Your Theme
Every panel, menu, and overlay automatically detects your NinjaTrader theme and adapts instantly — no manual toggle needed. Light mode for daytime setups, dark mode for night sessions. It just works.
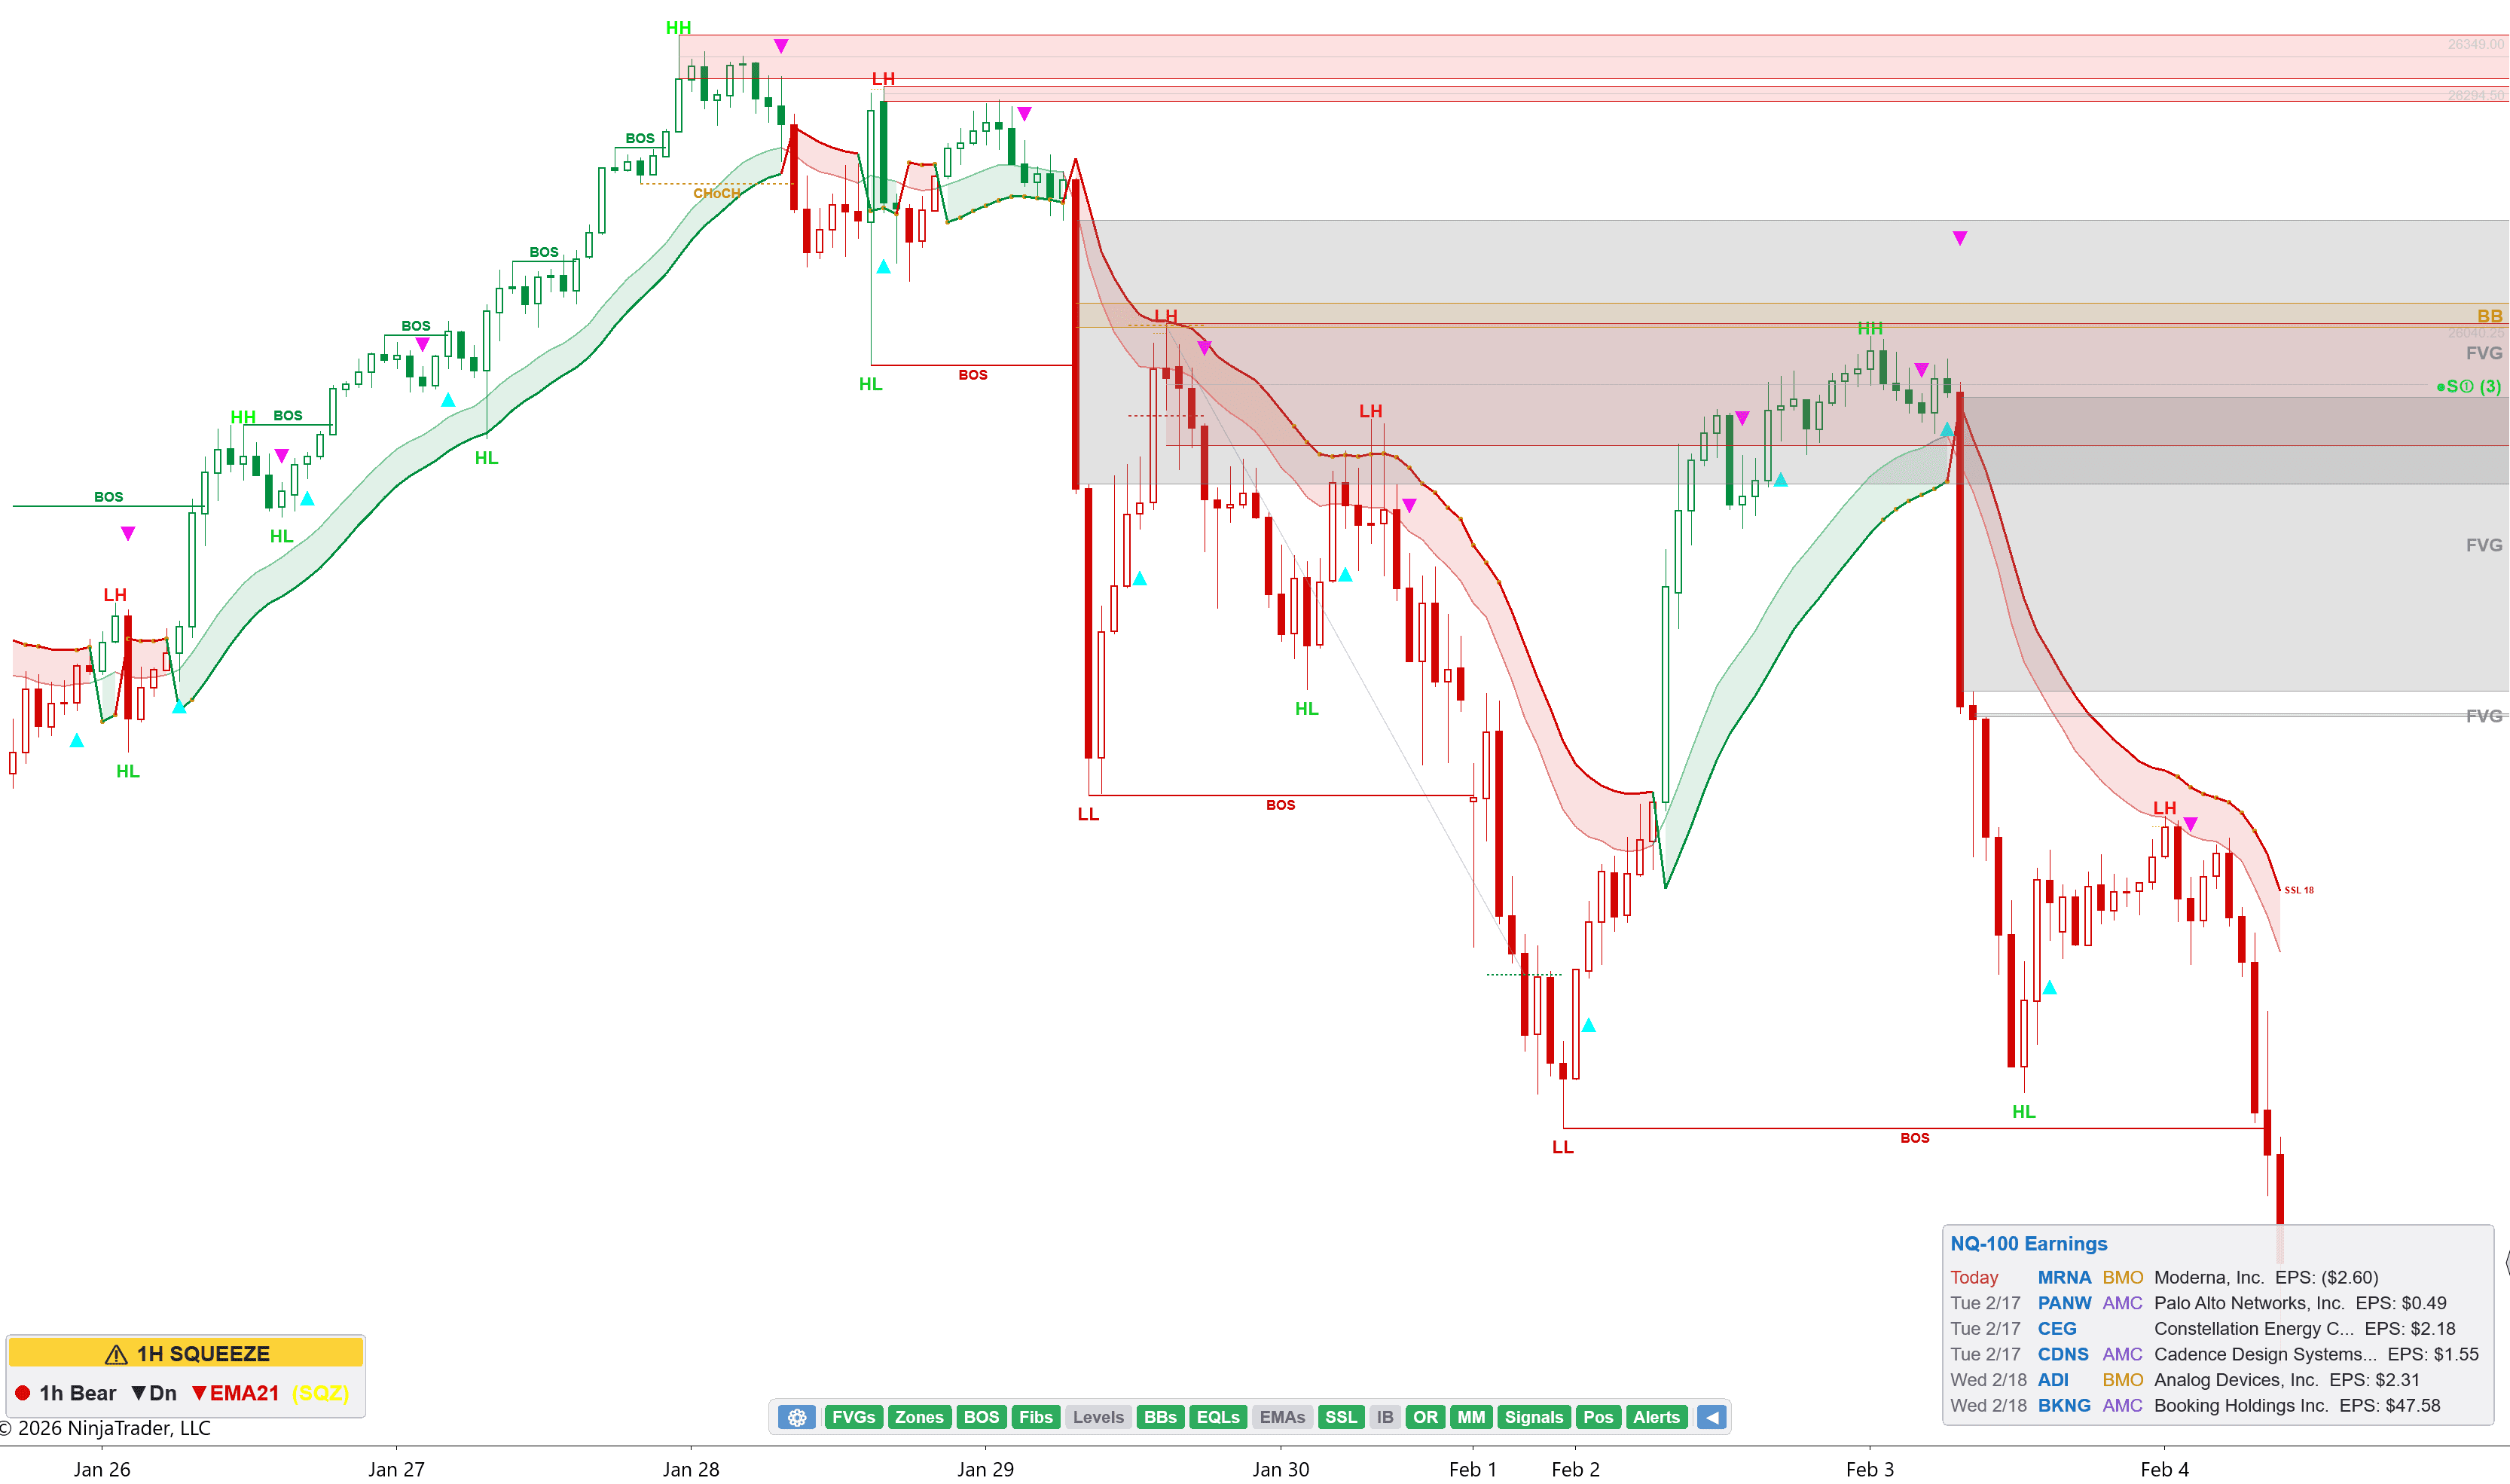
Quick Toggle Bar
One Click. Feature On or Off.
If you've ever used NinjaTrader, you know the pain: turning a feature on or off means right-clicking, digging through menus, waiting for a reload. It kills your flow and wastes precious seconds during active trading.
Our Quick Toggle Bar lives directly on your chart — a compact row of buttons for every major feature. Click once to toggle FVGs, Zones, BOS, Fibs, Levels, SSL, and more. Instant. No menu. No reload. No interruption. It's the TradingView-style experience that NinjaTrader has always been missing.
✕ The NinjaTrader Problem
Right-click → scroll through properties → find the setting → toggle → apply → wait for indicator reload. Repeat 10x per session.
✓ Our Solution
Click the button. Done. Feature toggles instantly with zero reload. Just like TradingView — but on NinjaTrader.
SSL Trend Bar Coloring
Cut the Noise. See the Trend.
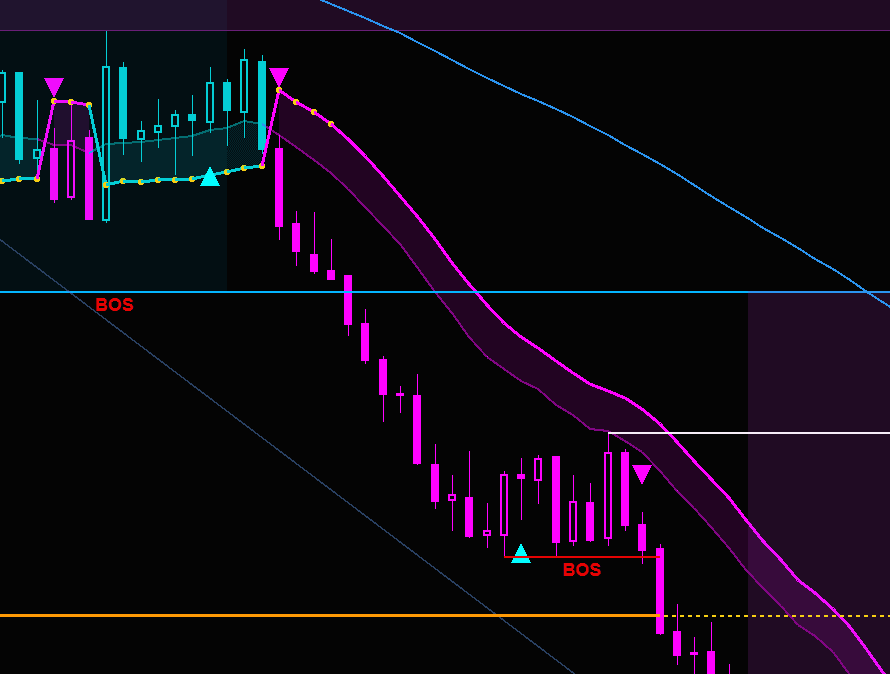
Some traders don't want all the lines and zones — they just want to see which way the market is moving. SSL Trend Bar Coloring replaces your candlestick colors with the SSL trend direction. Green bars when bullish, red when bearish. Clean, simple, instant.
Toggle it on from the Quick Toggle Bar — no indicator reload needed. Supports hollow candles for even cleaner visuals.
Consolidated Trend Display
See the Full Picture Across Every Timeframe
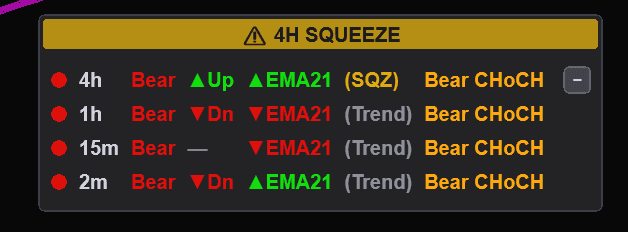
The consolidated trend panel pulls data from every chart you have open in NinjaTrader and displays it in one place — trend direction, BOS status, EMA alignment, squeeze state, and CHoCH across all timeframes. No multi-timeframe mode needed.
Trading inside a higher-timeframe squeeze is the fastest way to blow up your account. Bigger players are consolidating for the move — making price action unbearable with chop and stop hunts. A move may be coming. The MTF alignment helps you prepare: see it coming, stay out of the chop, and be ready to strike when volatility expands.
Measured Moves
Automatic Levels. Built-In Risk/Reward.
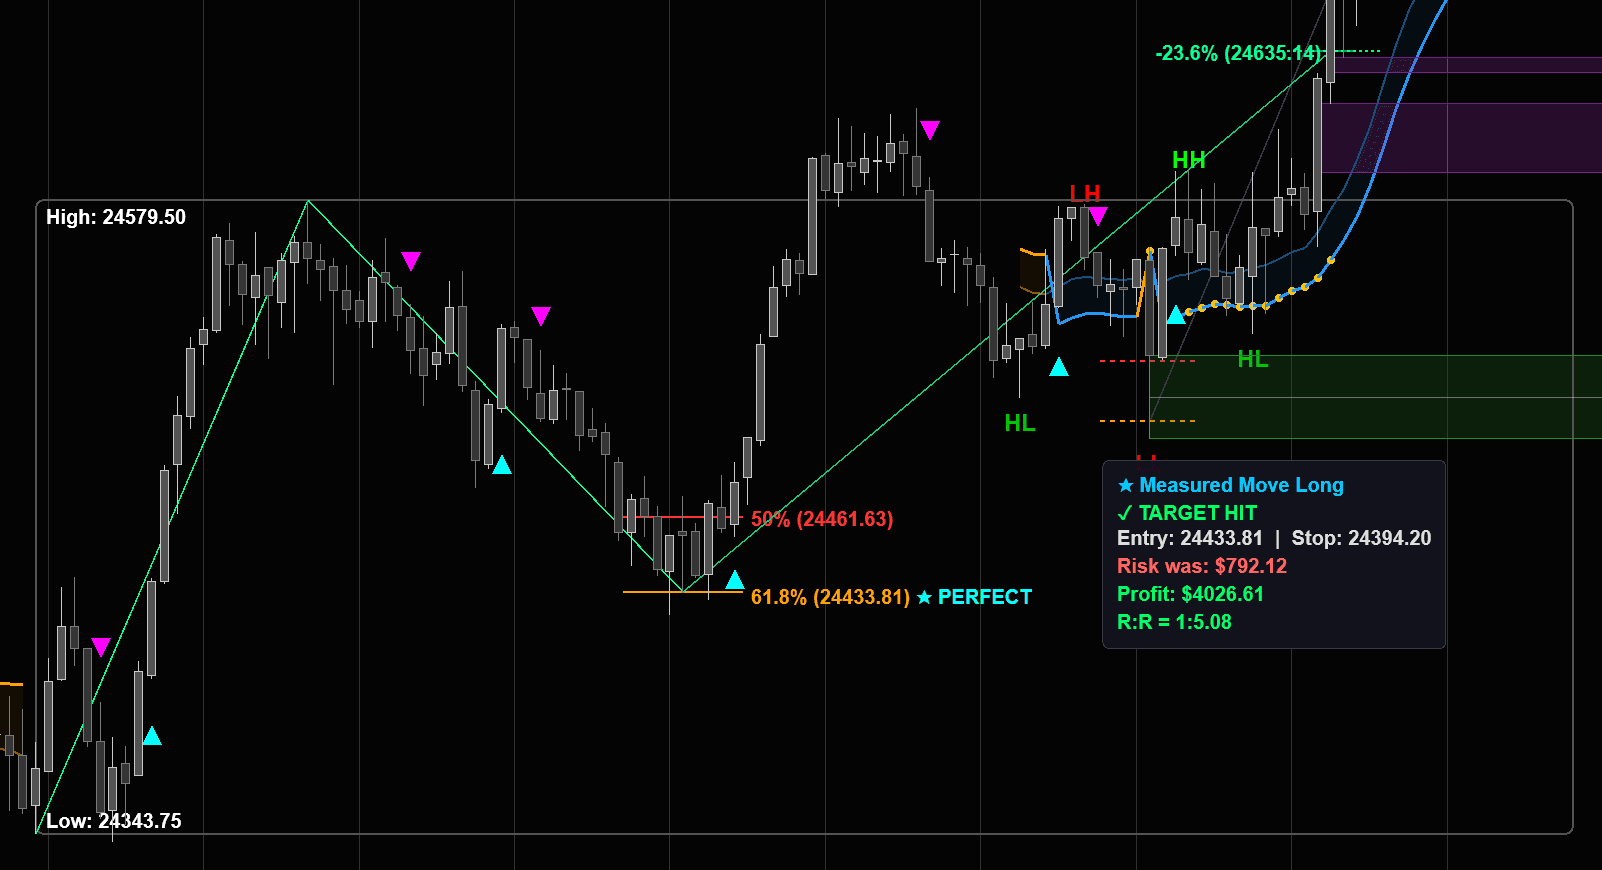
50% → 61.8% → -23.6% extension. This is the measured move pattern that drives price action across every instrument and every timeframe. Our indicator maps it automatically with built-in risk-reward calculations.
Markets often consolidate at the 50% and 61.8% zones for hours — trapping traders into thinking it's a bullish continuation when it's really accumulation for a major dump. The measured move tool shows you the full picture: where price is in the pattern, where the target is, and what your risk-reward looks like before you enter.
Breaker Blocks
Failed Order Blocks Become Breaker Blocks
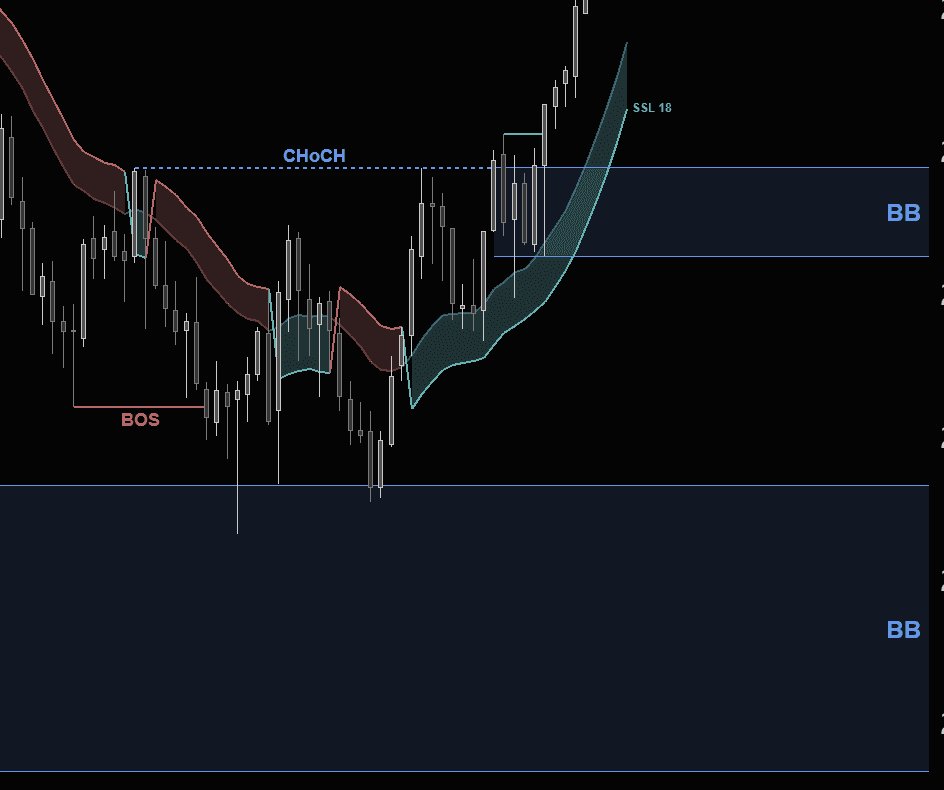
When an order block fails and price breaks through it, the zone flips into a breaker block — one of the most powerful reversal and continuation signals in smart money trading. Our indicator detects these automatically.
Breaker blocks mark where institutional positions were invalidated and liquidity was swept. Price often returns to these zones before continuing in the new direction. The indicator highlights them in real-time so you can plan entries at high-probability reaction zones instead of chasing.
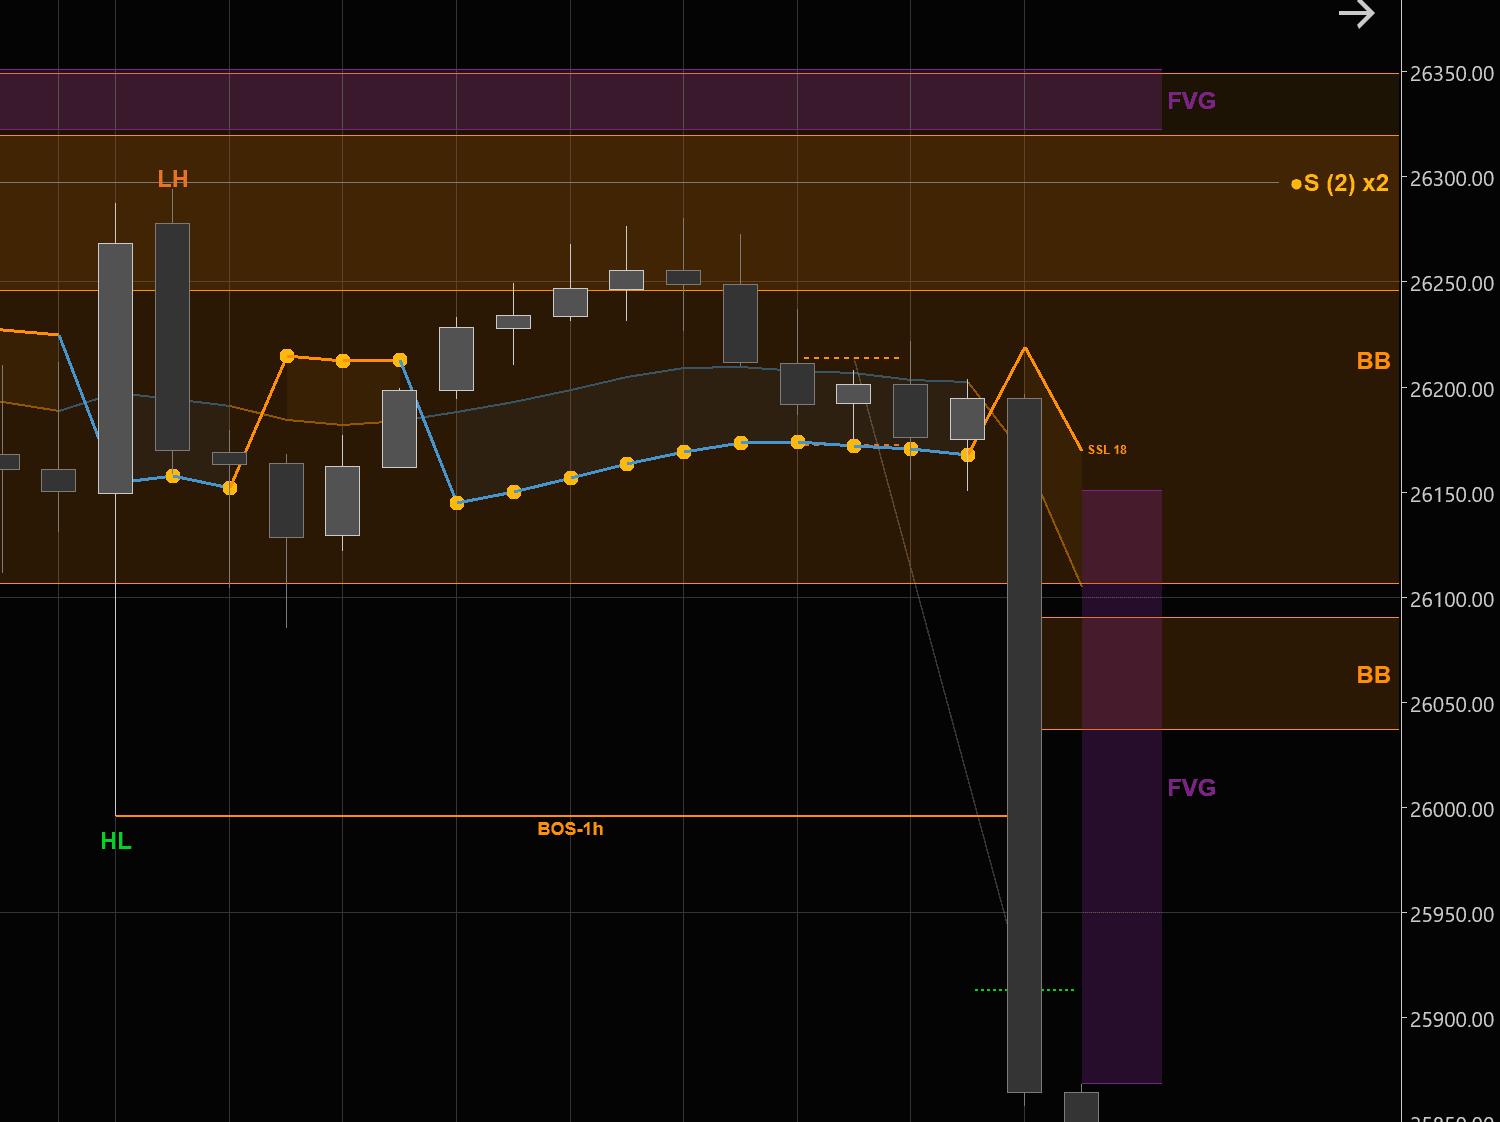
Squeeze Momentum
Compression. Then Expansion.
Some of our traders only trade squeezes — and for good reason. Price goes nowhere, chops around in a tight range, and then explodes. The built-in squeeze indicator shows you exactly when volatility is compressing and a big move is loading.
Trading inside the squeeze is brutal — choppy, indecisive price action that shakes out most traders. But when the squeeze fires, the entire range breaks and price commits hard in one direction. The indicator lets you sit on your hands during the noise and strike when the move is ready.
Supply & Demand Zones
Scored Zones. Smarter Entries.
Not all supply and demand zones are equal. Our indicator scores every zone based on how it was created — the strength of the departure, the freshness of the level, and whether it aligns with the higher-timeframe trend.
A high-score demand zone formed by an aggressive BOS with a clean FVG behind it is a completely different trade than a weak zone that's already been tested twice. The scoring system removes the guesswork so you focus on the zones that actually matter.
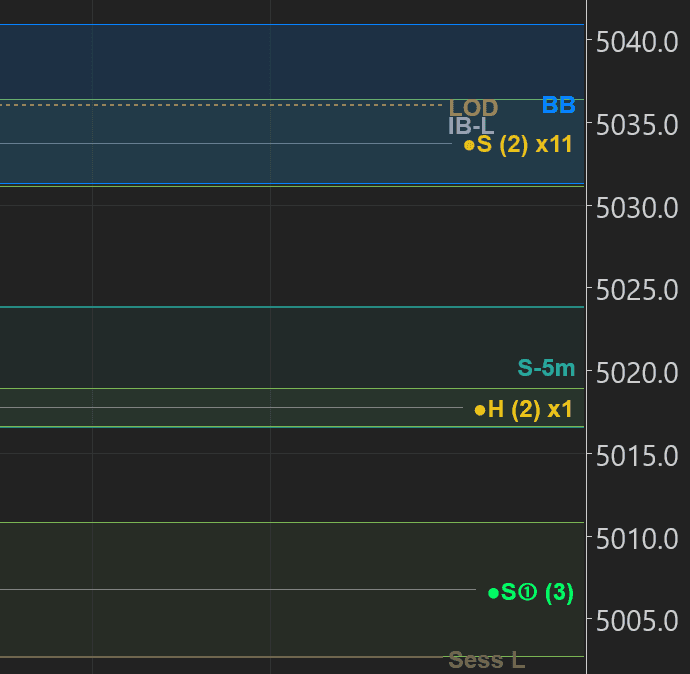
How to Read Zone Labels
Gamma Exposure (GEX)
See Where Options Dealers Are Forced to Trade
Institutional options dealers on the S&P 500 and Nasdaq 100 have to hedge every position they take on. Every time price moves, they buy or sell futures to stay flat. Their forced flow is mechanical, size-driven, and predictable — and it clusters at the exact same strikes every session.
FIMarketStructure pulls the live index options chain, computes each strike's gamma exposure, and draws the standout levels on your ES or NQ chart. Now you can see the walls institutions defend, the flip that separates a calm regime from a volatile one, and the strikes with the heaviest dealer positioning — without ever leaving your futures chart.
Built-In Auto Trader. Place It. It Manages It.
A full Chart Trader and trade-management engine right on your chart — draggable entries, four auto-trail modes, custom ATM strategies and account risk guards, from the entry through the exit.
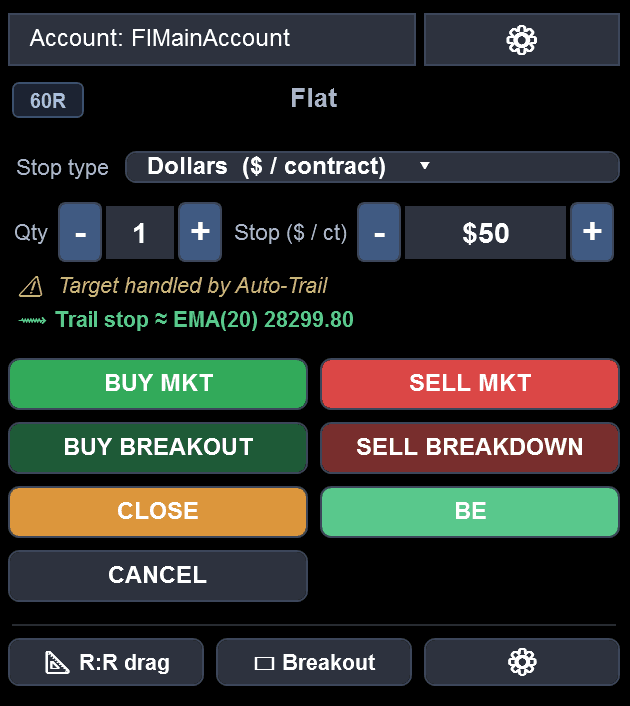
Draggable Entries
Pull your stop where you want it — entry, stop and target with live risk
Four Auto-Trail Modes
SSL line, 3-Step, Bar and EMA — the engine moves your stop tick by tick
Custom ATM Strategies
Run a saved NinjaTrader ATM template end-to-end from the panel
Account Risk Guards
Daily limits, trailing drawdown, and flatten-and-lock on breach
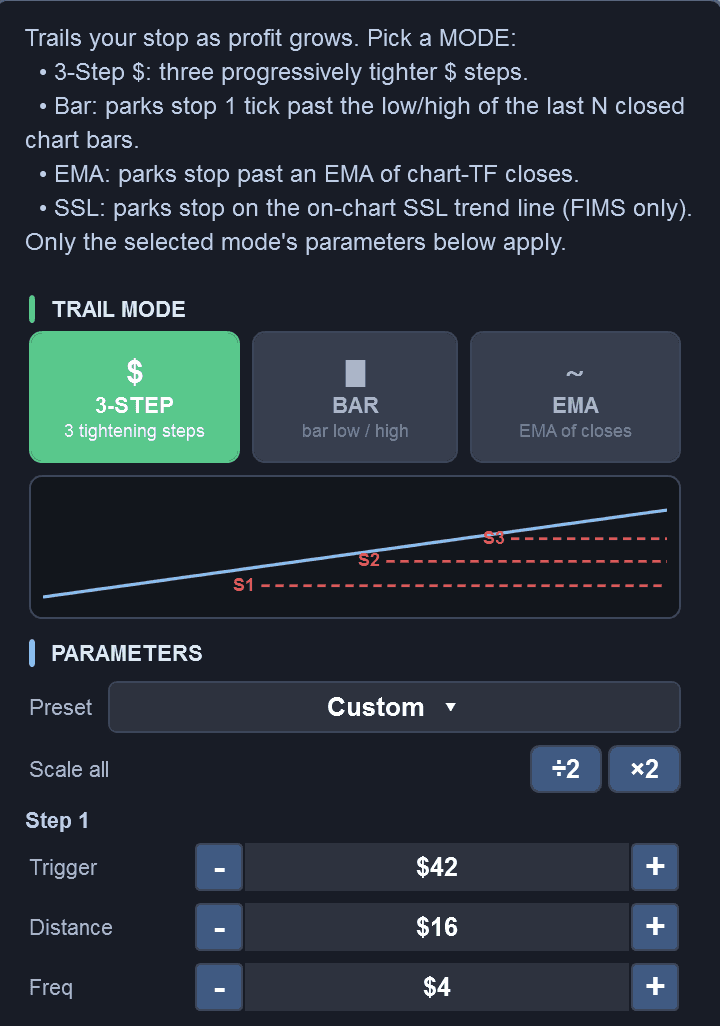
Auto-Trail
Four Ways to Trail. Pick One and It Runs.
Choose how your stop follows price and the engine trails it for you, tick by tick — with a live readout of exactly where the trailing stop sits. The manual stop field locks while a dynamic trail is driving it, and a position without a stop gets one automatically.
SSL Trend LineNew
Rides the on-chart SSL trend line
3-Step
Progressive tightening, presets for NQ, ES, MNQ, MES, CL, GC
Bar Trail
A tick past the low/high of the last N closed bars
EMA Trail
Past an EMA of chart-timeframe closes
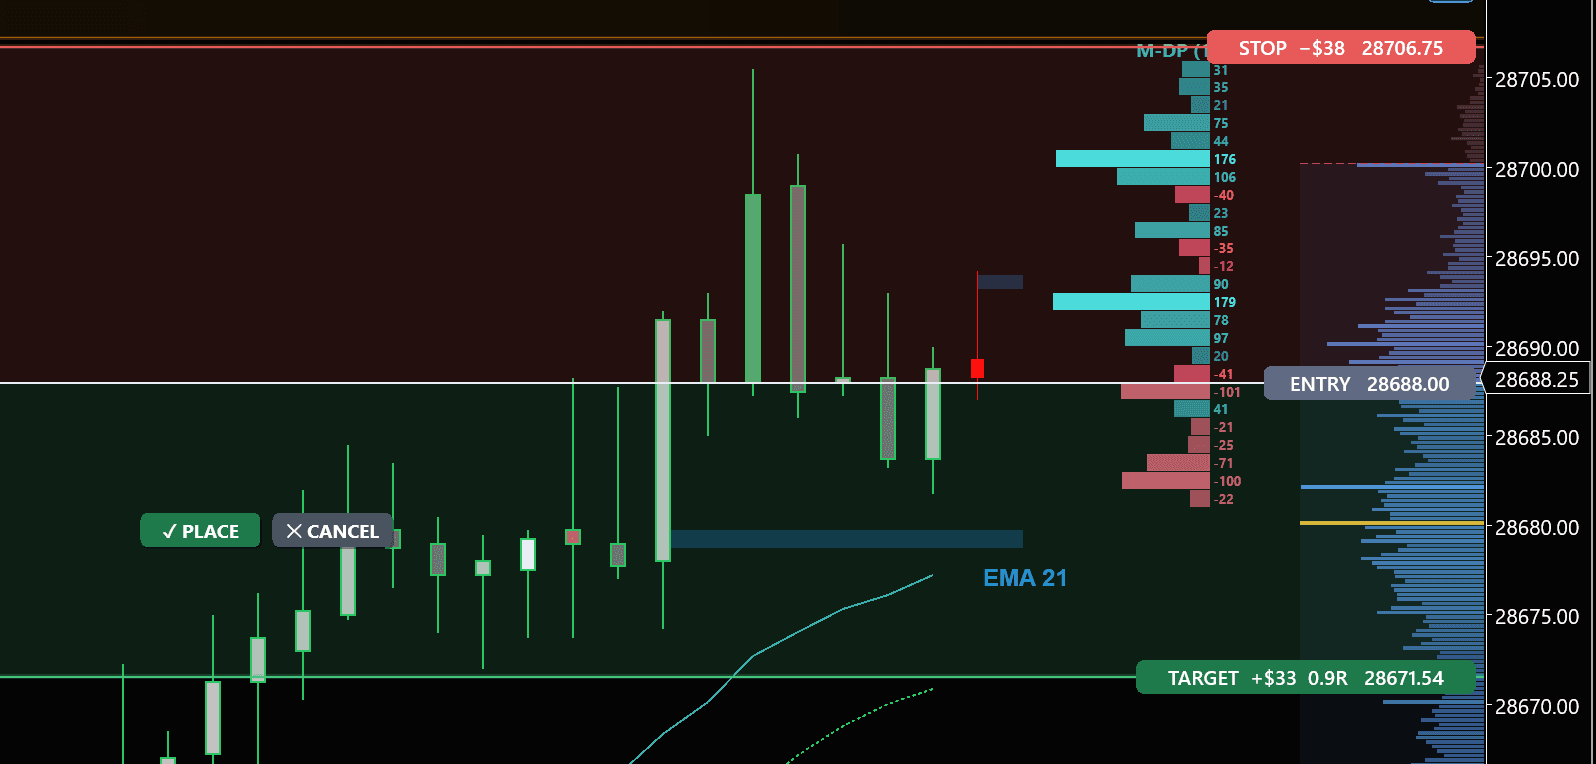
Draggable R:R Entries
Pull your stop to where you want it — the Auto Trader lays out entry, stop and target with live risk, then places the whole bracket in one click.
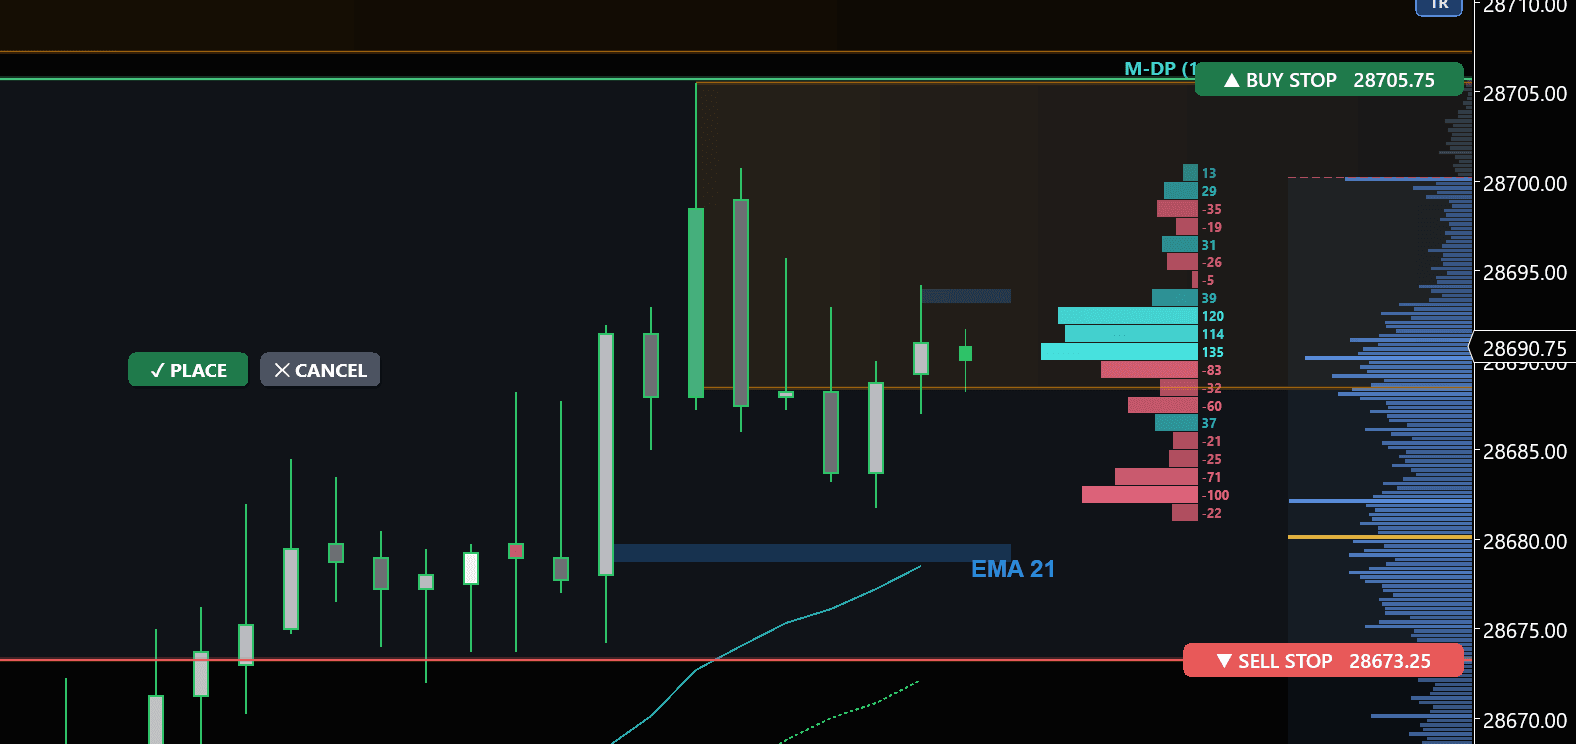
Draggable Range Breakouts
Drag across a range and the Breakout tool arms a buy-stop above it and a sell-stop below it — set to trade the break either way in one click.
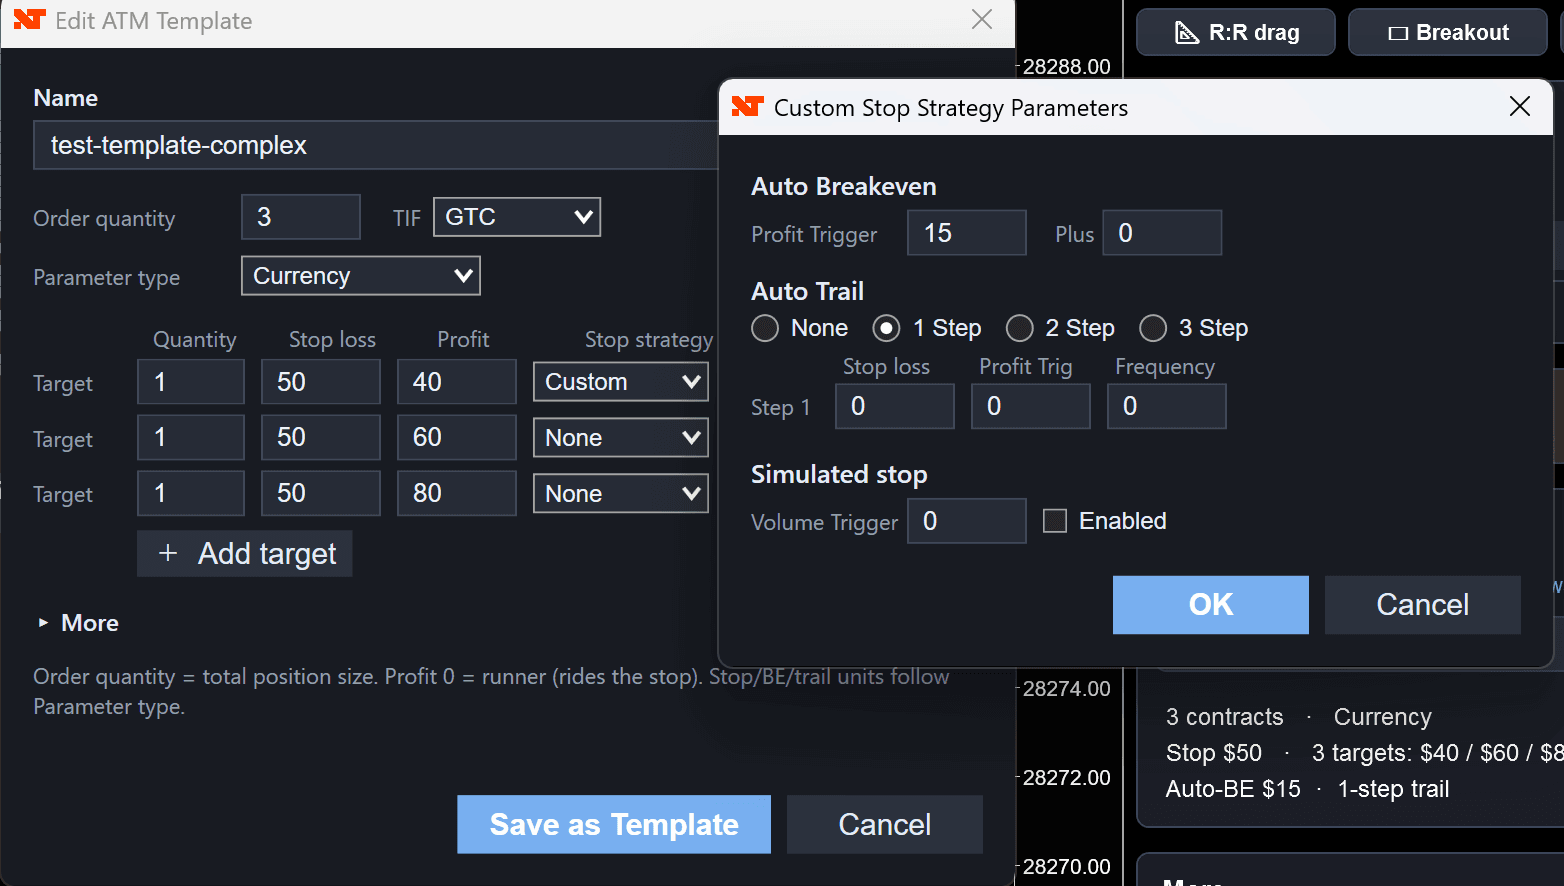
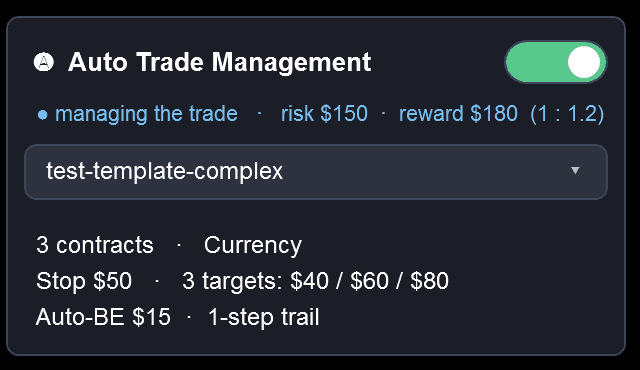
Custom ATM Strategies.
Build a full ATM strategy — multiple targets, per-target stop strategies, auto-breakeven and multi-step trailing — then hand it to the Auto Trader. Pick a saved template and the panel runs it end to end.
Everything Else It Handles for You
Toggle on only what you want — each one runs on its own once you're filled.
Auto Break-Even
Stop to break-even, with optional offset and per-instrument presets
Runner / Scale-Out
Take part off at the first target and let the rest ride the trail
Trail Behind Structure
Trail the last swing instead of a fixed distance
Time Flatten
Flatten the position at a time you set
Stagnation Exit
Optionally close out a trade that stalls
Risk Sizing
Size the position from the risk you're willing to take
Configurable Buttons
Reorder, offset, add or remove every entry and exit button
Risk Guards
Daily limits and drawdown — flatten-and-lock, block, or warn
Multi-Account P&L
Trade multiple accounts with live per-account and total P&L
Configurable Hotkeys
Buy, sell, close, reverse, close half, cancel all, stop to B/E
Click-To-Trade
Limit, stop and market orders straight from the chart
Light Mode, Too
The whole panel runs in a clean light theme
Test on a SIM account first. Before you place a single live trade, run the Auto Trader on a SIM account and get familiar with exactly how it manages a position — how it enters, trails and exits. It's included for every customer. Trading involves risk, including the loss of principal.
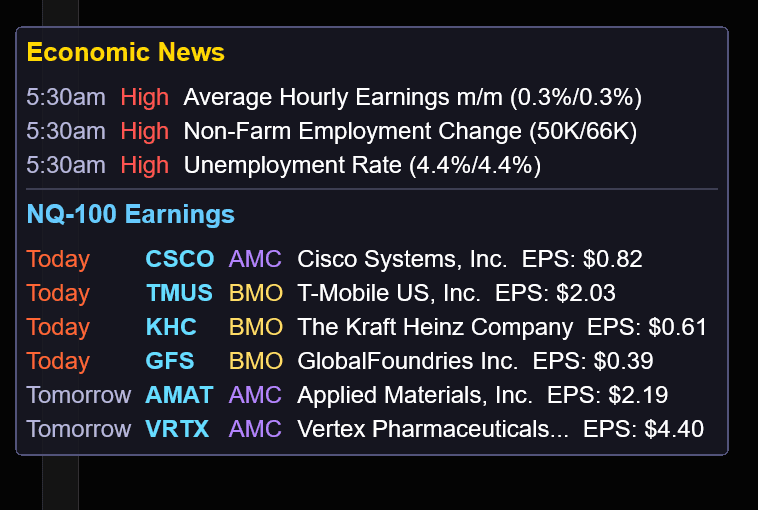
Economic News Panel
Never Get Blindsided by News Again
High-impact economic events move markets in seconds. The built-in news panel shows today's economic calendar and NQ-100 earnings right on your chart — no browser tabs, no alt-tabbing, no surprises.
See FOMC, CPI, NFP, and other market-moving events with impact ratings, forecasts, and previous values. Plus NQ-100 earnings dates so you know when your favorite names are reporting before or after the bell.
Pro Drawing Tools. Built In.
Volume Profile, Risk/Reward, and Fibonacci Retracement — right on your chart. All three included because they should be standard.
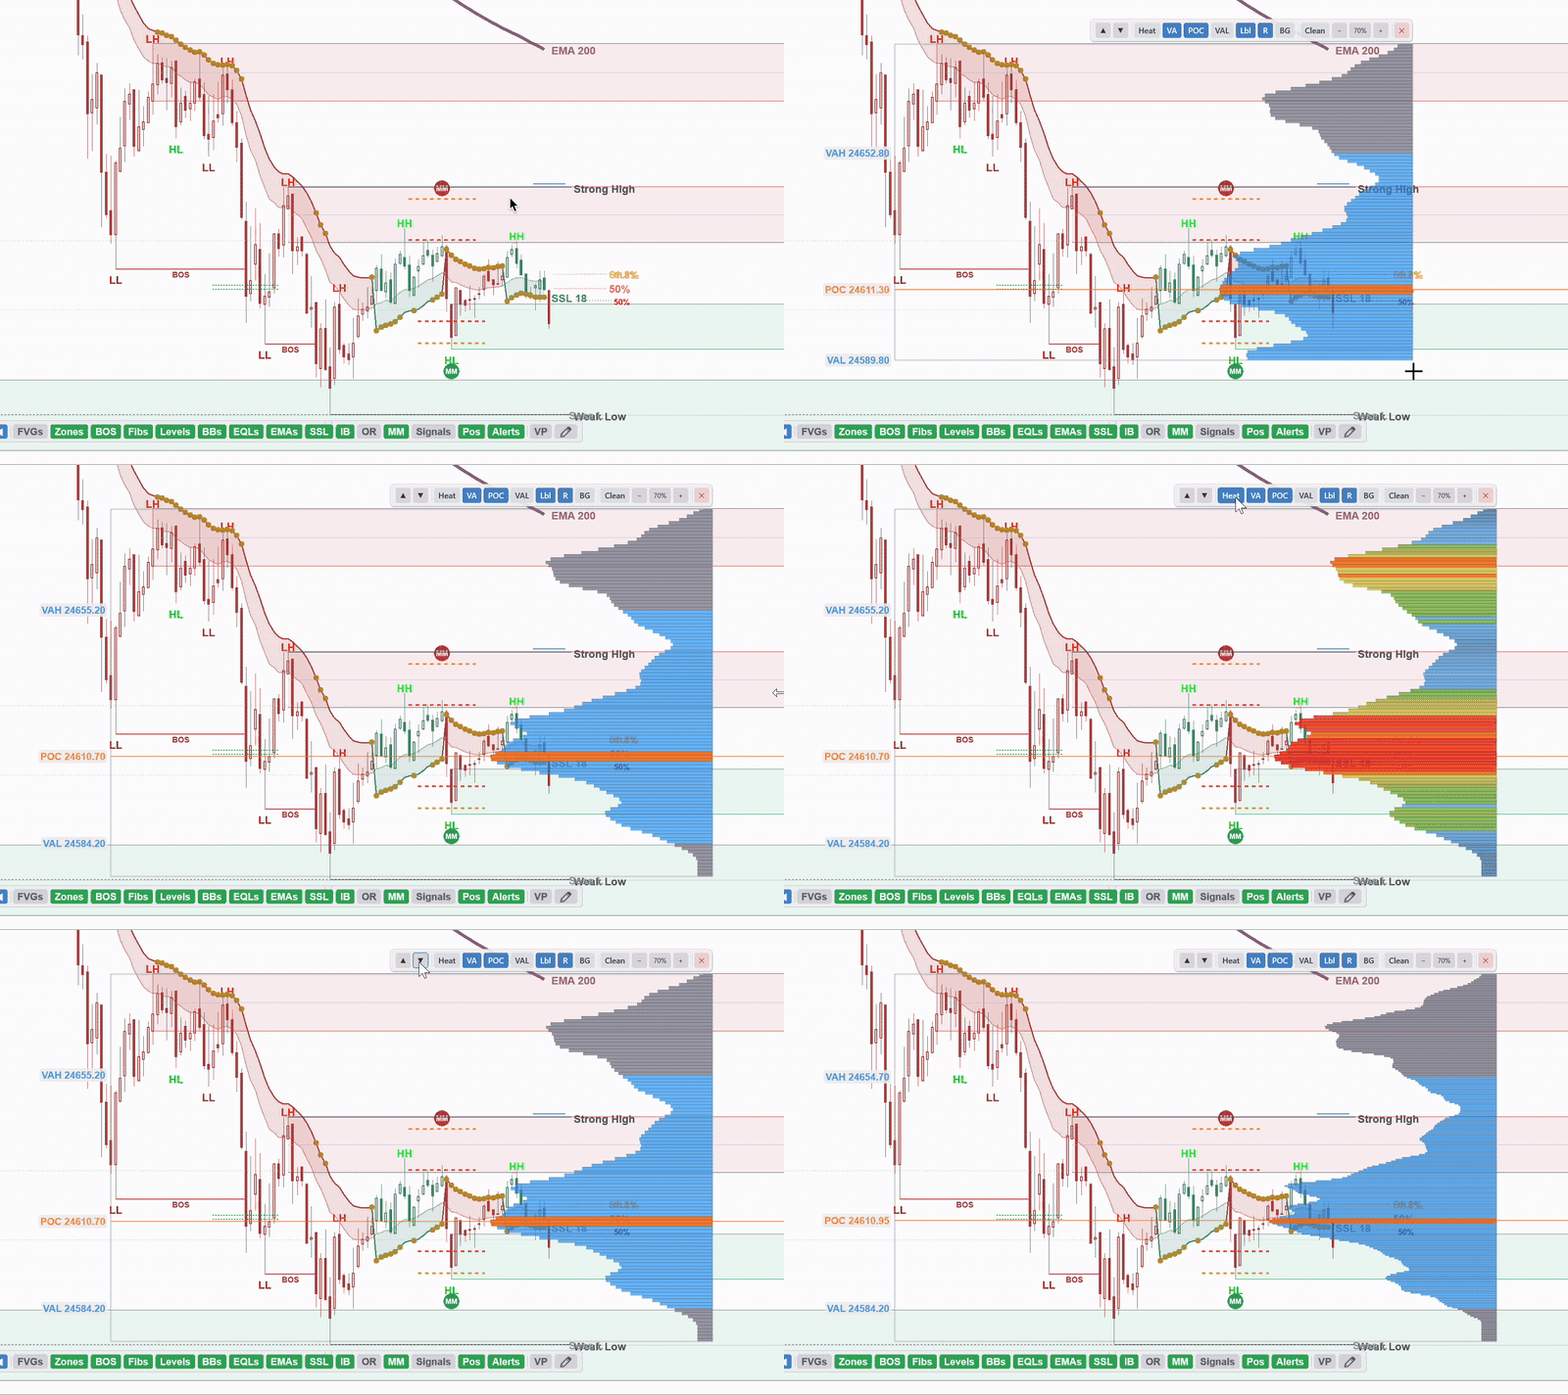
Volume Profile
Click and drag to build a volume profile for any range on your chart. See exactly where the real volume traded — POC, Value Area, VAH/VAL — with a built-in toolbar to toggle every element instantly.
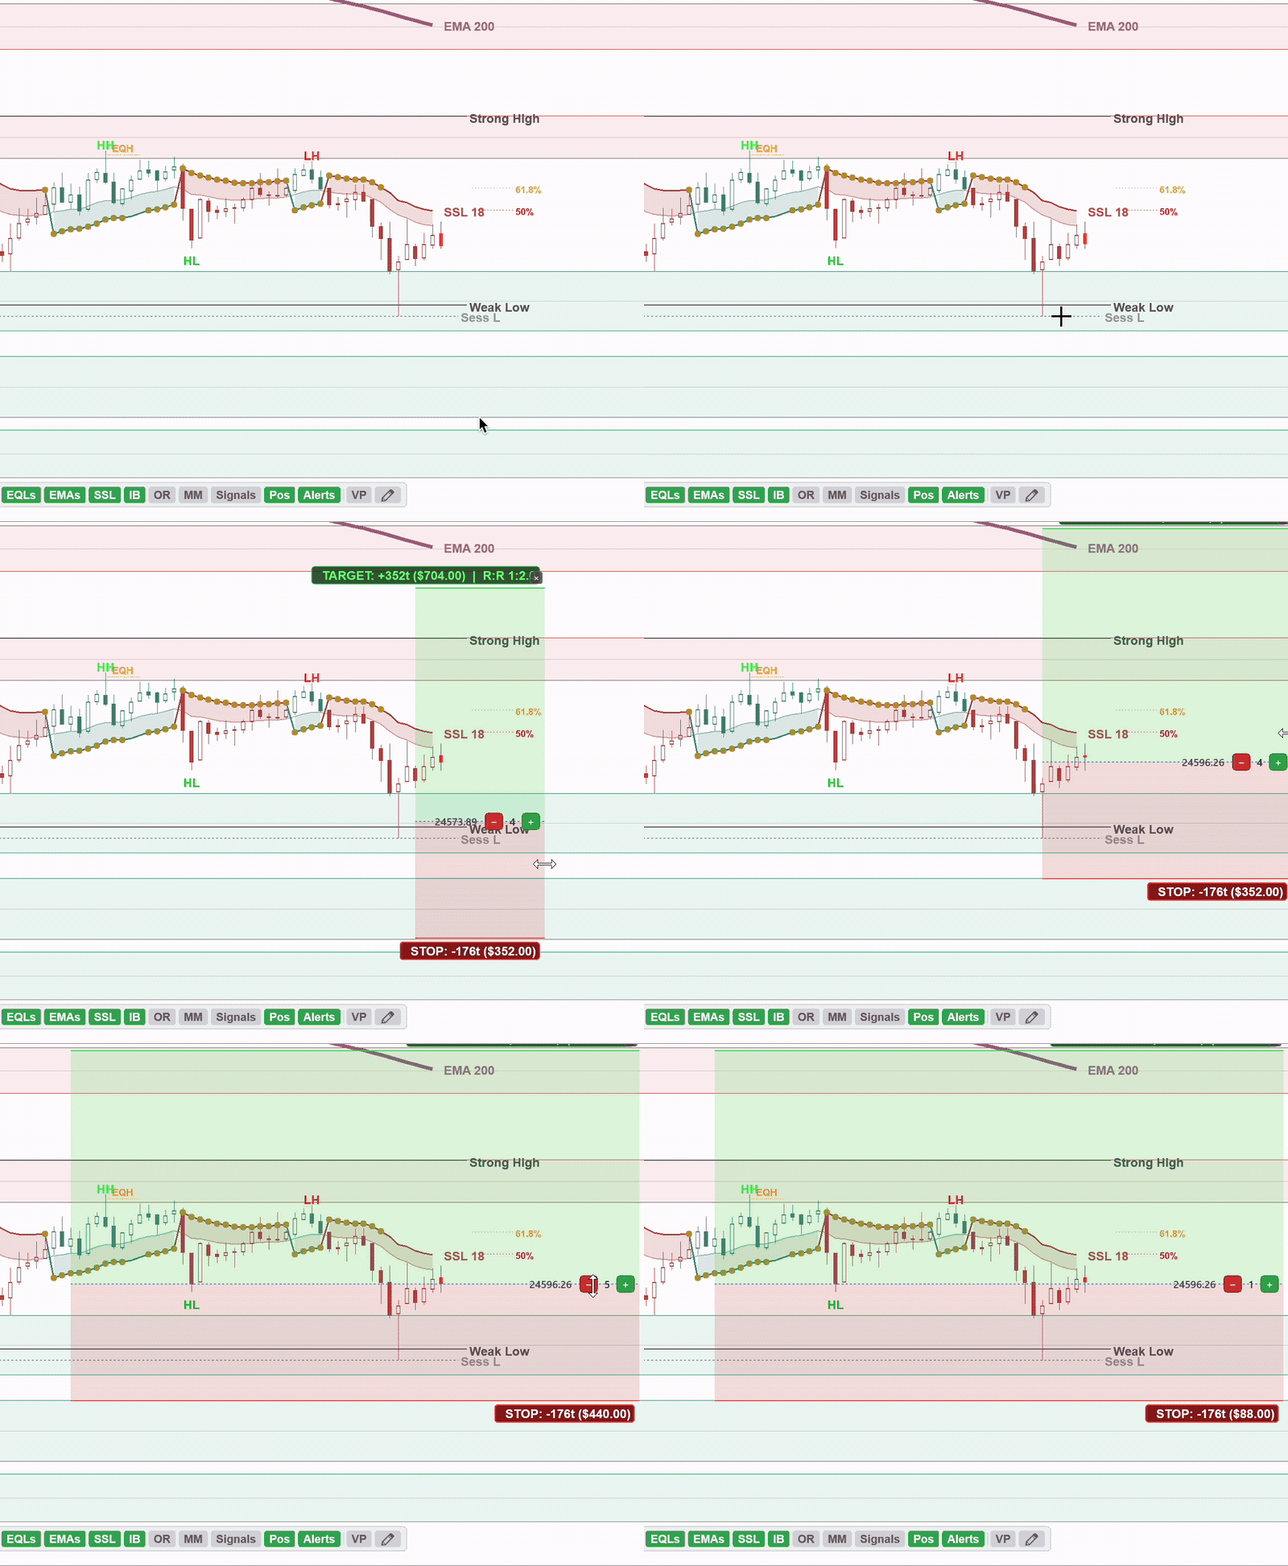
Risk/Reward
Click and drag to place a position risk/reward overlay directly on your chart. See your stop loss, profit target, ticks, dollar risk, and R:R ratio update in real-time. Adjust contracts with +/- buttons right on the drawing.
Simple by design. We wanted a dead-simple risk/reward calculator that measures your risk in seconds — no clutter, no learning curve. Risk management tools should come standard.
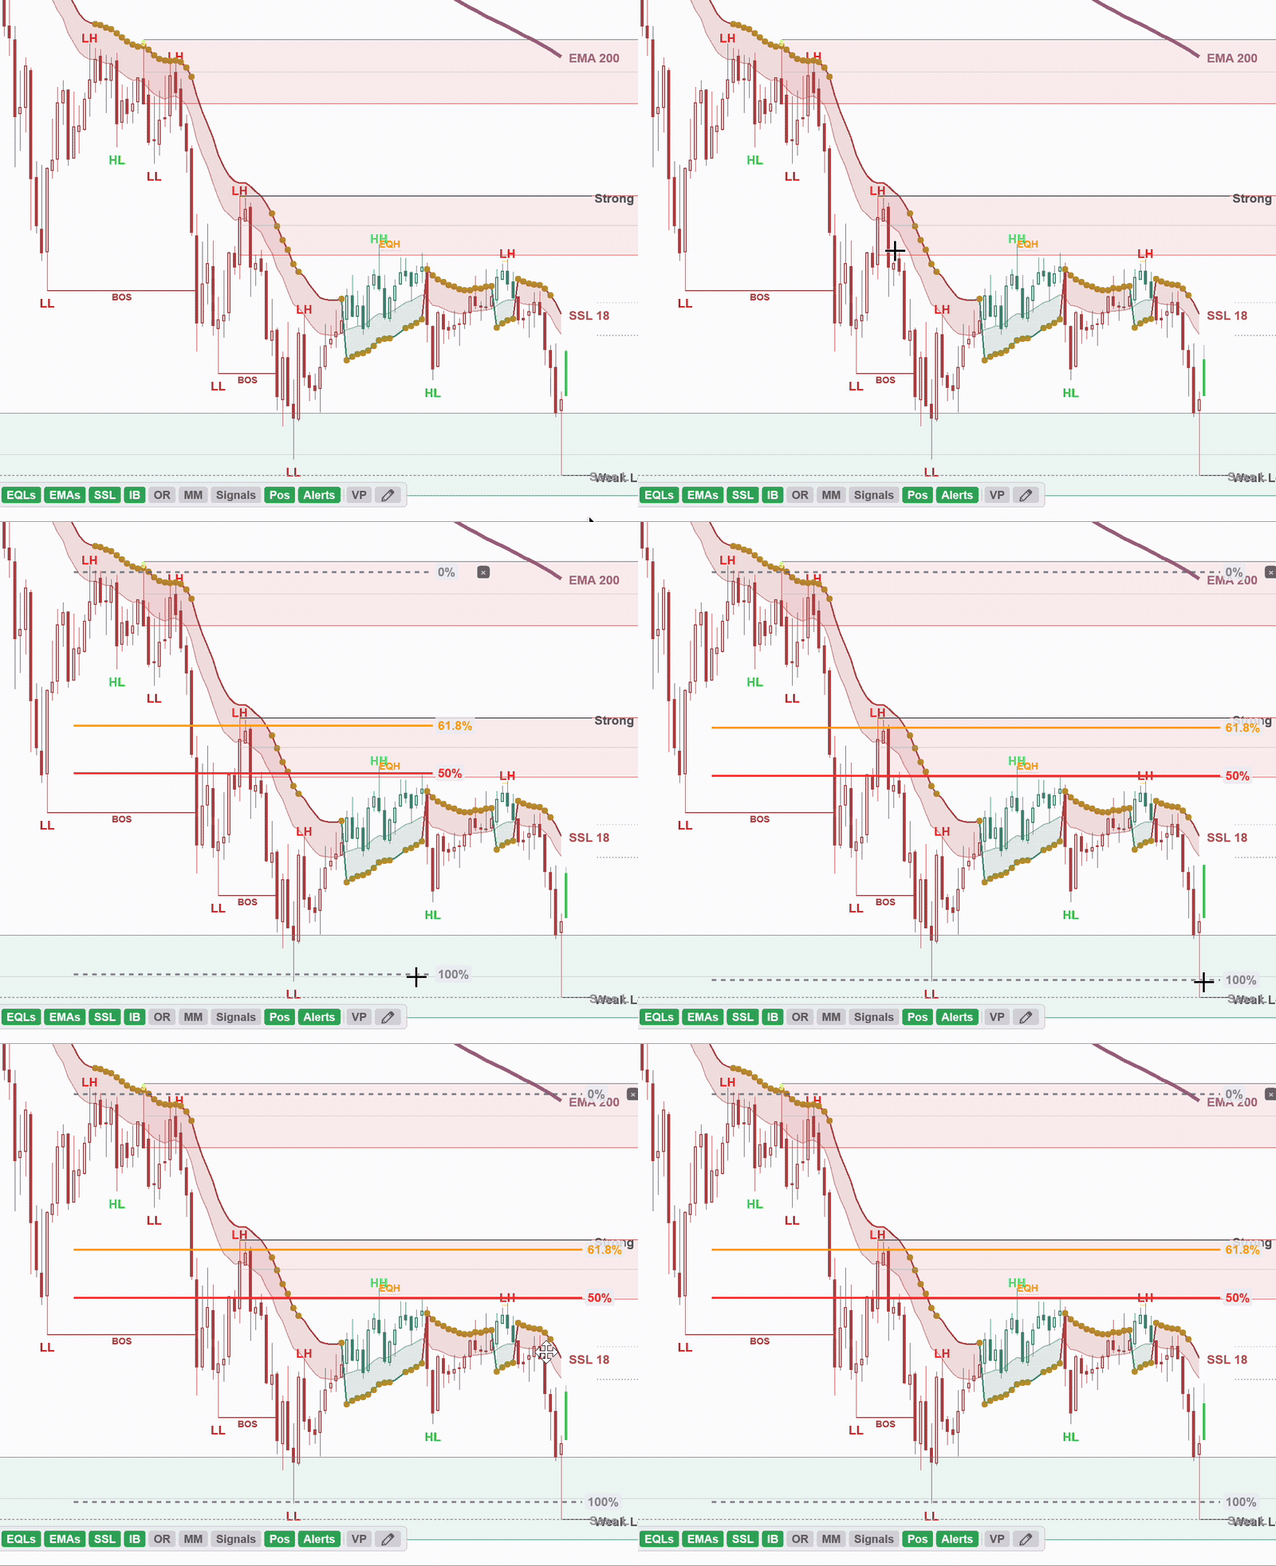
Fibonacci Retracement
Click two points to draw Fibonacci retracement levels instantly. Drag the anchor points or the body to reposition. The golden zone (50% and 61.8%) is highlighted so you can spot high-probability entries at a glance.
All Drawing Tools Included — No Extra Charge
Every drawing tool comes with your indicator license. No add-ons, no upsells, no “pro tier” required.
POC, VA, VAH/VAL, Heatmap, Toolbar
Stop, Target, R:R, Ticks, Contracts
All Levels, Zone Fills, Draggable
Volume Bars. Relative Volume on Your Chart.
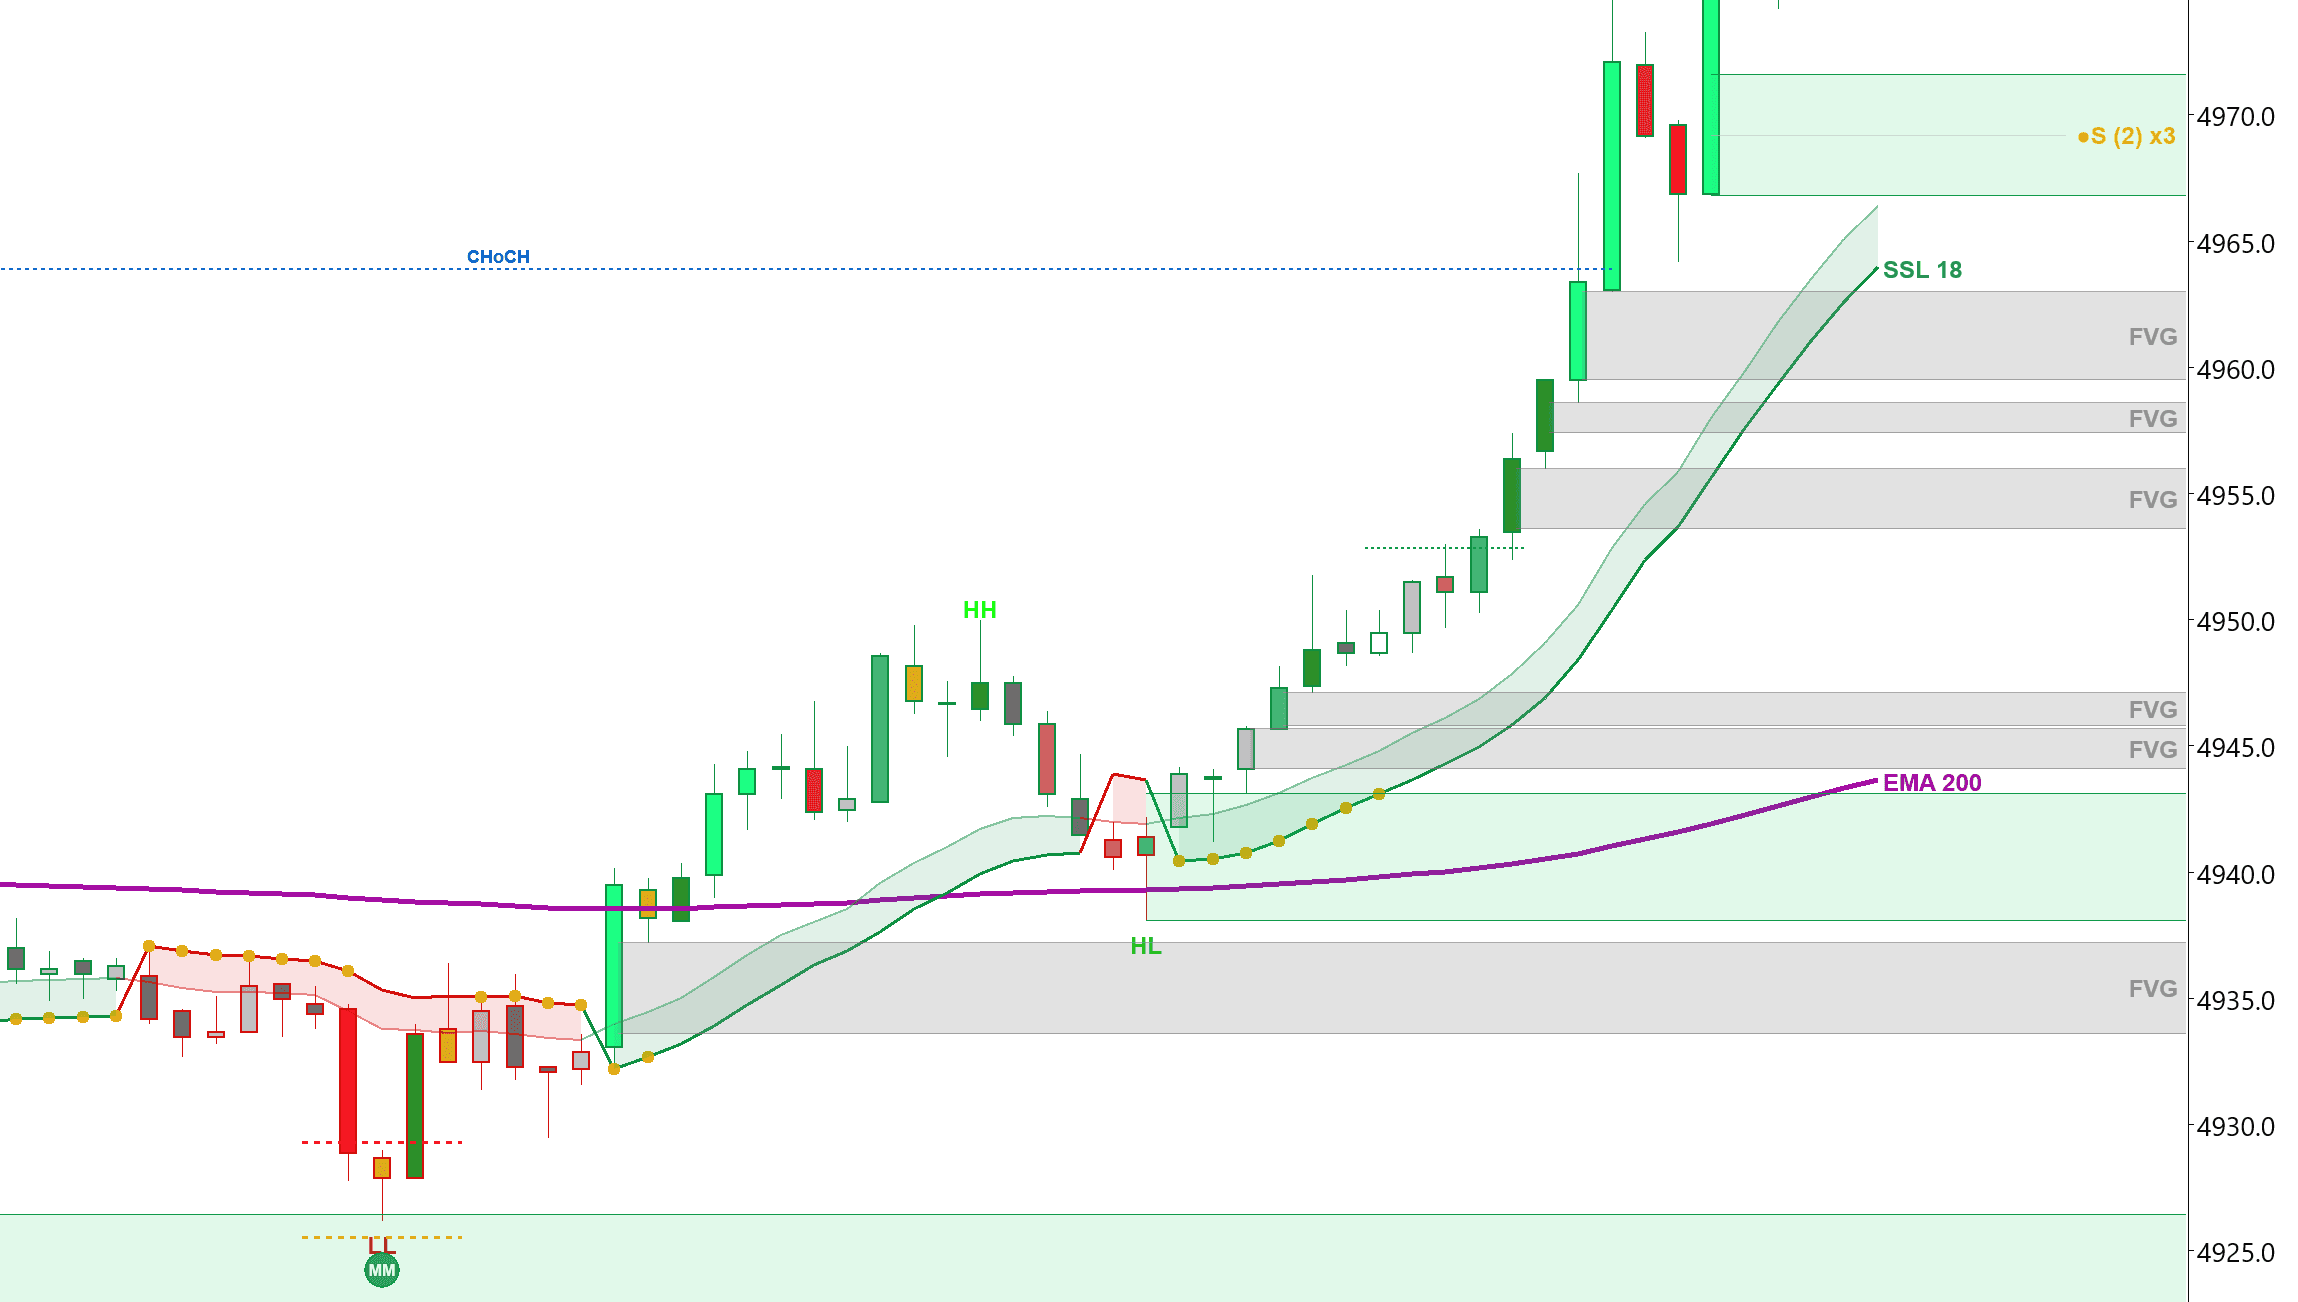
Measure 1x, 2x, and 3x relative volume directly on your chart. When volume spikes at a key level, that's your clue — real participants are engaged and it's time to pay attention.
Relative Volume
Volume is the one thing that can't be faked. When you see 2x or 3x relative volume printing at a key support or resistance level, that's a clue — real participants are active and something is about to happen. It won't tell you the direction, but it tells you to pay attention. Volume Bars make this instantly visible without cluttering your chart.
Normal Volume
Baseline activity — market is moving at its usual pace
Elevated Volume
Something is happening — buyers or sellers are stepping in
Extreme Volume
Institutional-level participation — pay close attention to price action here
Volume is a clue, not a signal. When increased volume appears at a key level — a demand zone, a BOS, or the opening range boundary — it tells you real participants are engaged. Combine it with your price action read to time entries with conviction. Fully configurable thresholds, colors, and display options so you can dial it in to your exact trading style.
Know When to Stay Out
Low volume kills profits. When bars are printing at 0.5x or below normal volume, price gets pushed around with no confirmation from real buyers or sellers. It's chop — and choppy markets eat stop losses for breakfast. Volume Bars make this painfully obvious so you can protect your capital.
Low volume = lose your profits. The biggest edge isn't finding entries — it's knowing when not to trade. Volume Bars turn that instinct into a visual system you can rely on every session.
Engineered for Speed.
NinjaTrader is notorious for chart lag when indicators get complex. Load up BOS detection, supply & demand zones, squeeze momentum, and multi-timeframe analysis on a single chart and most indicators will grind your platform to a halt. High-volatility sessions make it even worse — exactly when you need speed the most.
Most NinjaTrader indicator developers are traders who learned to code — and there's nothing wrong with that. But it means performance engineering gets overlooked. Our indicator was built by professional software engineers who trade. We applied production-grade architecture and advanced data caching strategies so that your charts load fast, stay responsive during high-volatility sessions, and never miss a beat when it matters most.
Most traders turn off their indicators before FOMC, CPI, and NFP releases because they know their charts will freeze the moment volatility spikes. We don't want you to have to do that. The moments when the market moves the fastest are exactly when you need your tools the most — and that's when ours performs best.
3s → 1s
Benchmarked Chart Load
We benchmarked a chart reload from 3 seconds down to 1. That may not sound like much — but in indicator development, it's a massive win
Zero
Wasted Computation
The indicator is smart about what it recalculates — only new data triggers work
100%
Accuracy Preserved
Speed without compromise — every level, zone, and signal is always accurate
Instant Chart Reloads
Switch timeframes, change days to load, reopen a chart — the indicator picks up where it left off. No waiting, no progress bars, no staring at a frozen screen.
High-Volatility Ready
During fast markets, every millisecond counts. The indicator stays responsive when other tools choke — so you can focus on the trade, not the loading spinner.
Always In Sync
Change your settings or load a different date range and the indicator automatically adapts. No stale data, no manual resets — it just works.
Shaving 2 seconds off a chart load doesn't sound like much — until you realize how hard it is. In NinjaTrader indicator development, performance is the hardest problem to solve. Most developers never even attempt it. We packed more features into one indicator than most traders run across six — and engineered it to run faster than any of them individually. That's the difference between an indicator built by traders who code and one built by engineers who trade.
Buy & Sell Signals
Simple Directional Arrows. Powerful Context.
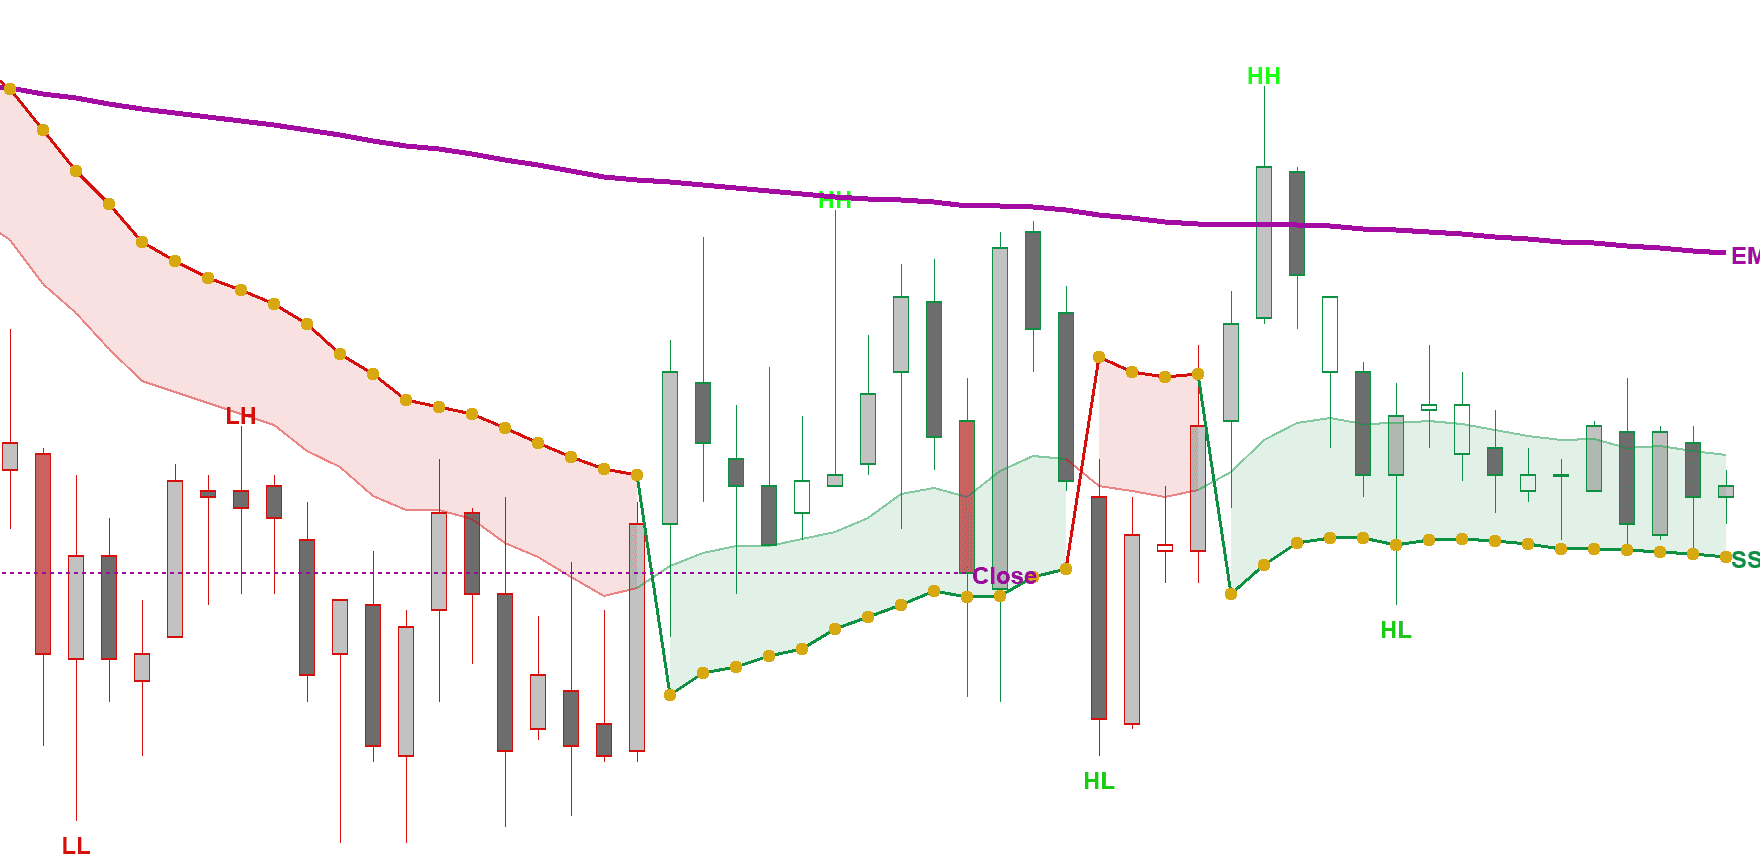
Clean buy and sell arrows show you where the market wants to go next. They're not meant to be traded blindly — but combined with structure, EMAs, and squeeze analysis, they become a powerful confirmation tool.
In this example on the MNQ 5-minute chart, price hit the 61.8% measured move level at the top and rejected hard. From there the market started printing lower lows and lower highs below the 20-period SSL inside a range — a textbook short setup. The sell arrows confirmed direction while structure, the measured move rejection, and SSL provided the confluence for a clean entry.
Disclaimer: Buy and sell signals are analytical tools only and do not constitute financial advice or recommendations to buy or sell any security. All trading involves risk, including the loss of principal. We are not responsible for any financial losses incurred from using this indicator. Past performance is not indicative of future results.
Trade Journal — Built-In Performance Analytics
Track every trade automatically. View daily performance, analyze win rates, profit factors, and drawdowns. Connect your trading account and start building a complete journal of your edge.
Calendar View
See daily P&L, trade count, and win % at a glance
Dashboard
Weekly summary with charts, metrics, and trends
Trade Analysis
Detailed table of every trade with entry, exit, and P&L
Win Rate Tracking
Monitor your win % and profit factor over time
Drawdown Analysis
Track maximum drawdown and recovery patterns
Session Breakdown
Performance by session, instrument, and trading style
Daily Performance at a Glance
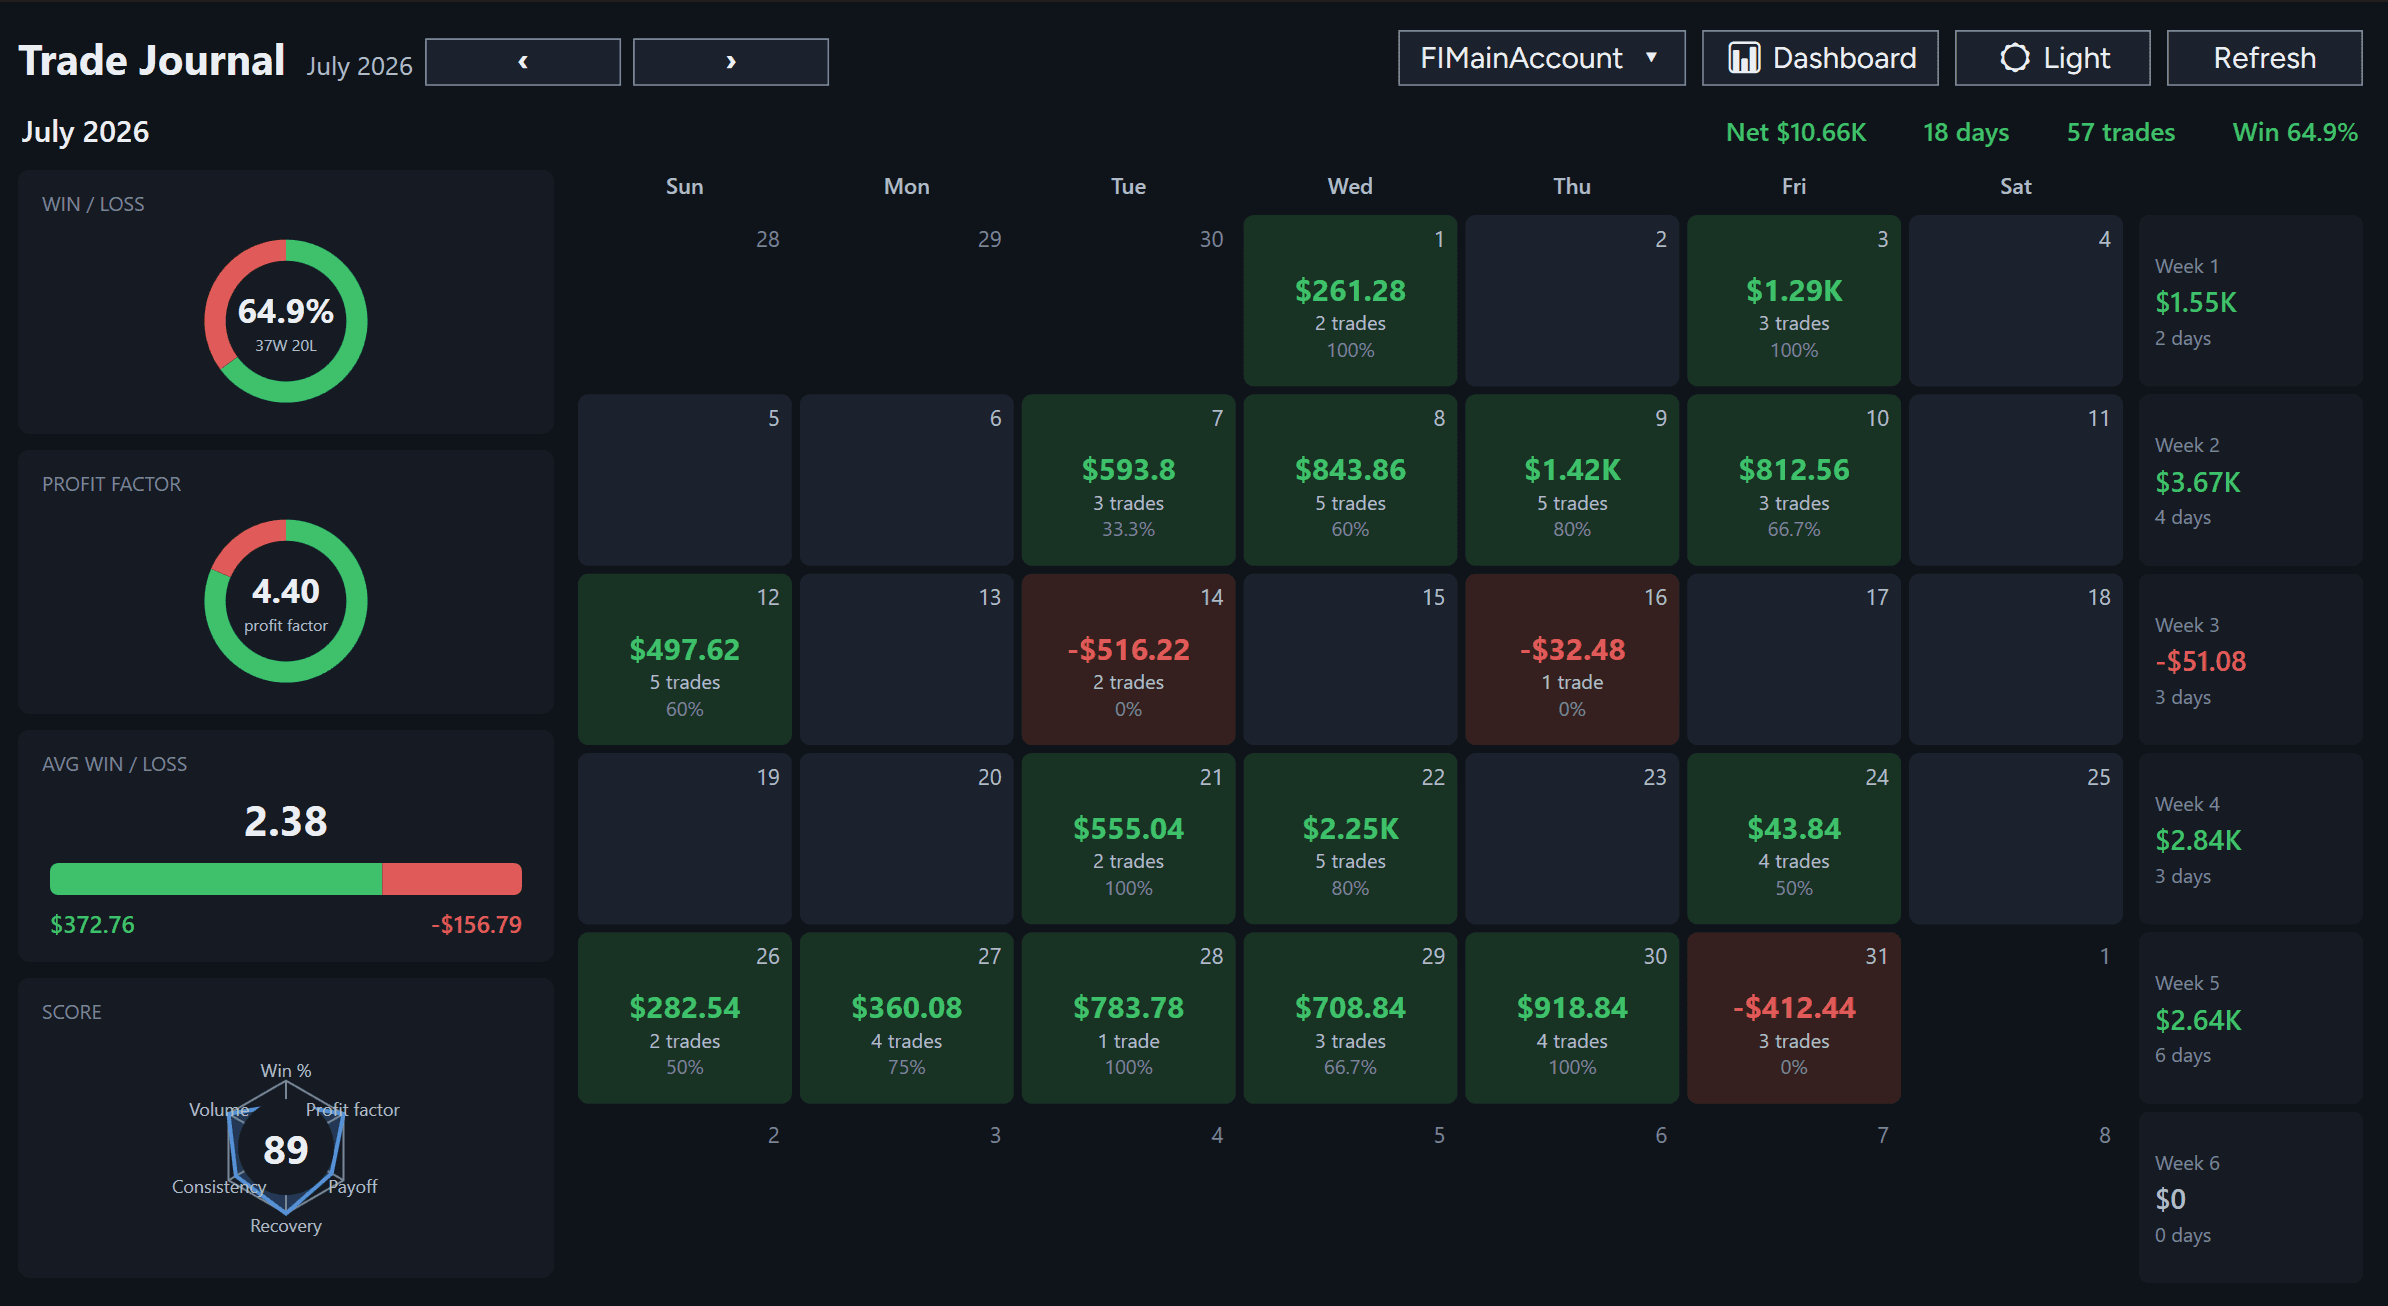
The calendar view gives you a bird's-eye view of your entire month. Every trading day displays your net profit/loss, number of trades, and win percentage for that session — all color-coded so winning days stand out at a glance.
Green Days = Profitable Trading
Winning days appear in green with your profit amount, trade count, and win rate. Instantly see which days your strategy worked and which ones need analysis.
Red Days = Losing Days Surface Patterns
Losing days appear in red with the loss amount. Track whether losses come from drawdowns on good setups, or from trading outside your edge. Click any day to drill into the trades.
Weekly Summary on the Right
The right sidebar shows rolling weekly totals: net P&L, days traded, total trade count, and aggregate win rate. Spot which weeks your edge was firing and which were off.
What this tells you
- Which days align with your best trading psychology
- Whether your edge holds up across different market conditions
- Patterns in profit and drawdown cycles
- Session-to-session consistency and variability
Use the calendar to spot your best and worst trading days, then review the trades from those sessions to understand what market conditions and setups matter most.
Weekly Summary with Charts
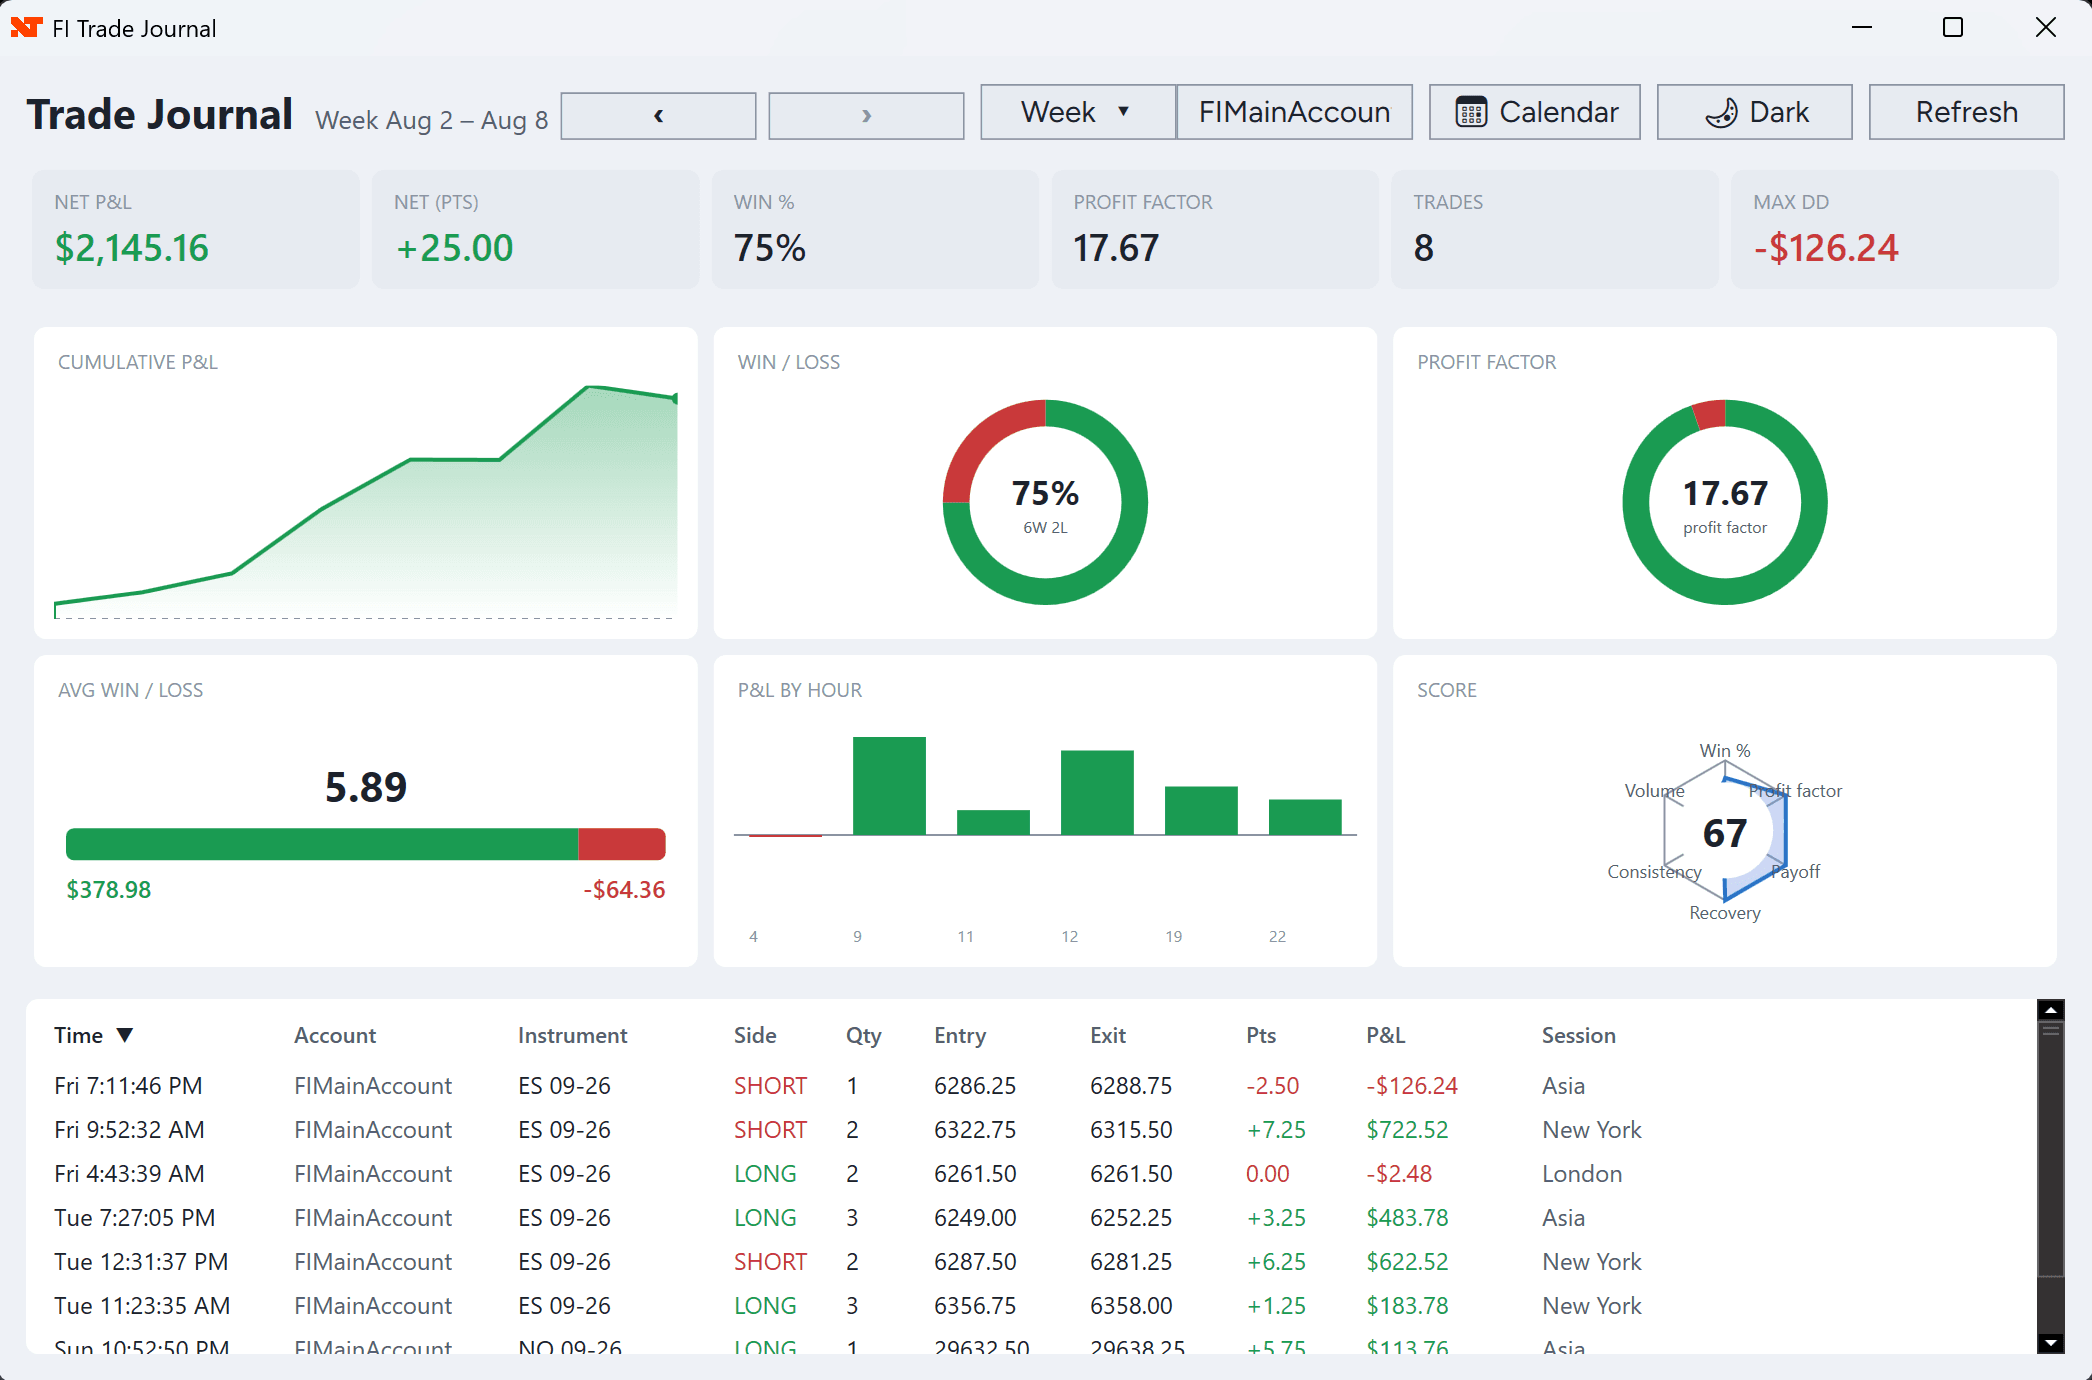
The dashboard view aggregates a week of trading into one screen with professional analytics: cumulative P&L chart, win/loss pie chart, profit factor, max drawdown, and a detailed trades table.
Cumulative P&L Chart
Watch your cumulative profit or loss across the trading week. See exactly when you hit your peak equity and whether losses were recovered in the same session.
Win Rate & Profit Factor
The pie chart shows your win percentage and the profit factor display shows your average win divided by average loss. A profit factor above 2.0 is considered strong.
Key Metrics at a Glance
Net P&L, Net Points, Win %, Profit Factor, Total Trades, and Max Drawdown — all visible above the detailed trades list so you can assess your week in seconds.
What this tells you
- Whether your win rate is sustainable
- If your average win is larger than your average loss
- Peak drawdown in the week and recovery time
- Trading volume and activity patterns per day
A 50% win rate with a 2:1 profit factor (wins 2x the size of losses) is mathematically profitable. Use these metrics to validate that your trading edge actually works.
Drill Into Every Trade
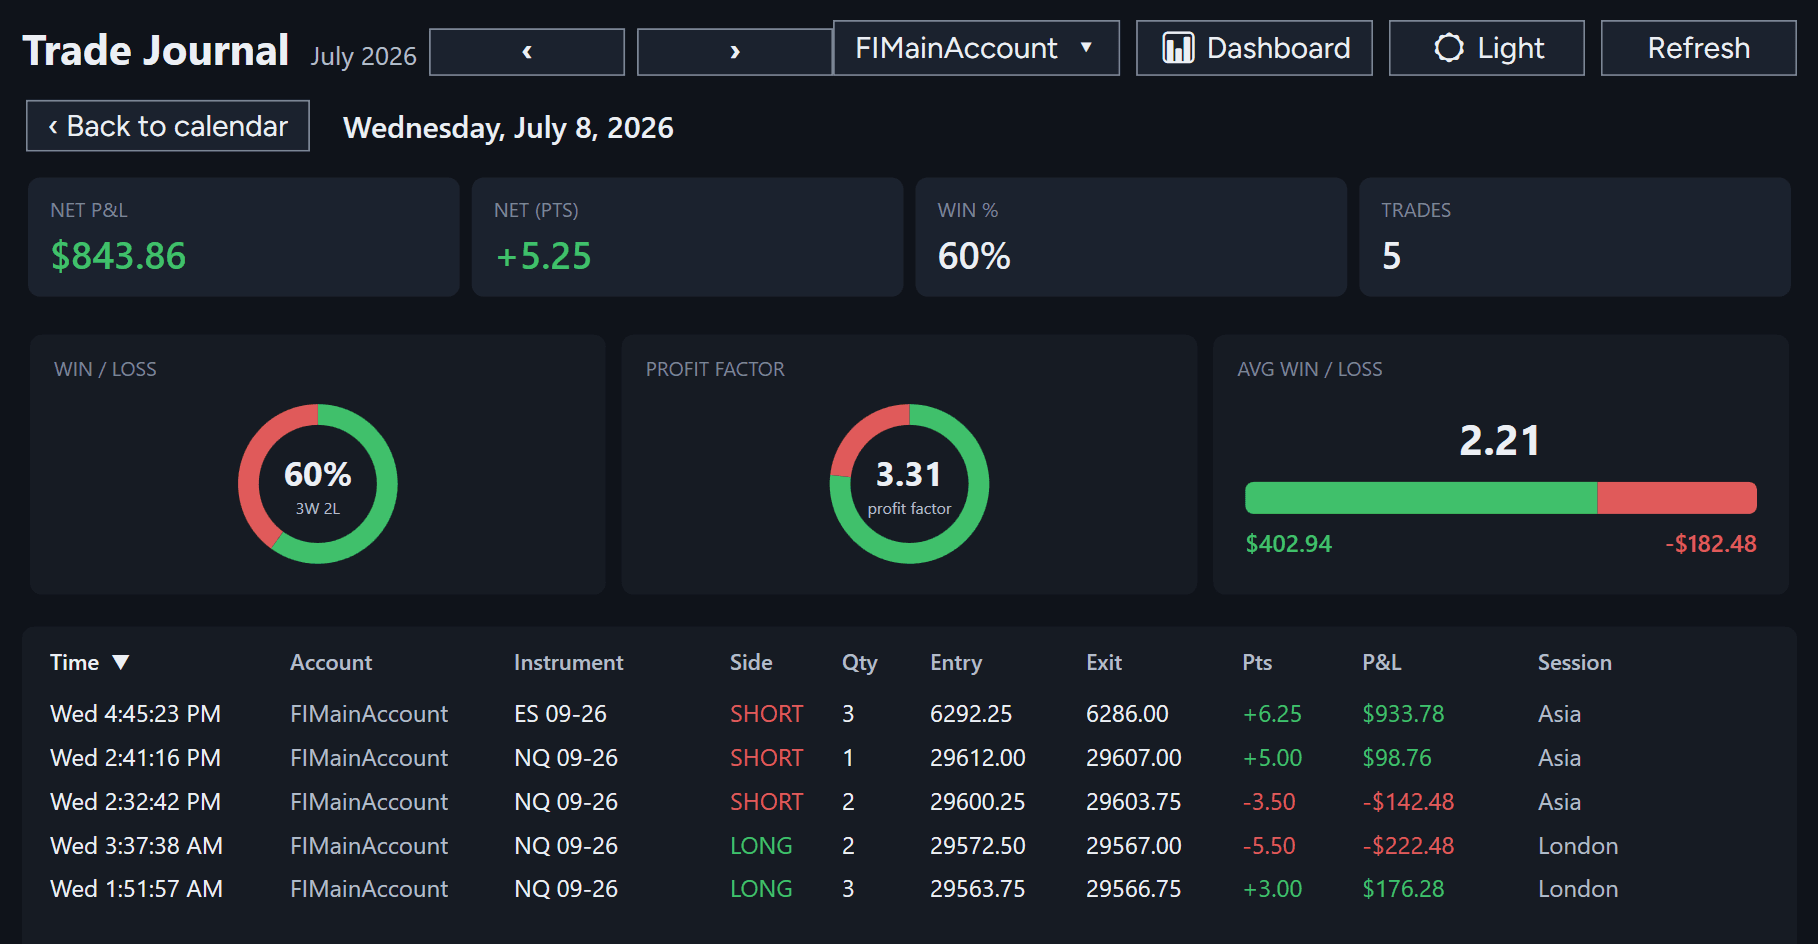
Click any calendar day and the journal switches to day view. You see the session's metrics, performance charts, and a complete table of every single trade: time, instrument, side (long/short), entry price, exit price, quantity, and P&L in dollars and points.
Complete Trade Audit Trail
Every field you need to review a trade is displayed: time of execution, instrument, direction, entry level, exit level, quantity, points gained/lost, P&L in dollars, and trading session zone (Asia, New York, London, etc.). Nothing is hidden.
Session-Level Metrics
At the top of the day view, see your session totals: NET P&L, NET PTS (points), WIN %, TRADES, WIN/LOSS pie chart, PROFIT FACTOR, and AVG WIN/LOSS breakdown. Spot outliers instantly.
Color-Coded Wins & Losses
Profitable trades show in green, losing trades in red, and breakeven trades in gray. Scan the table and your eyes immediately gravitate to problem trades so you can review them.
What this tells you
- Exactly which trades were most profitable
- Whether losses came from one or two bad trades, or consistent bleeding
- Trade timing relative to market sessions and volatility
- Your average winner and loser sizes for that session
Review your biggest 3 winners and 3 losers each week. Pattern matching those trades will reveal what works in your edge and what should be filtered out or avoided.
The Numbers That Matter
The Trade Journal calculates and displays the metrics every serious trader tracks to measure and optimize their edge:
Net P&L
Total profit or loss in dollars across your trades. The bottom line of your trading performance.
Win %
Percentage of trades that are profitable. A 50%+ win rate with proper risk management is tradeable.
Profit Factor
Gross profit divided by gross loss. A 2.0 factor means wins are 2× the size of losses on average.
Max Drawdown
Largest peak-to-trough decline in equity. Shows how much your account could drop in a worst-case sequence.
Avg Win / Avg Loss
Your average profitable trade vs. your average losing trade. Shows your risk:reward asymmetry.
Trade Count
Total number of trades in the period. More data = more reliable statistics about your edge.
Pricing
Simple, One-Time Pricing
No subscriptions, no recurring fees. Buy once and own it forever.
Market Structure Indicator
For NinjaTrader 8
$349
One-time payment • Lifetime license
- Built-In Auto Trader — Entries, Auto-Trail & Risk Guards
- Quick Toggle Bar — One-Click Controls
- BOS & CHoCH Detection
- Opening Range & Initial Balance
- EMAs & SSL Channel
- Squeeze Momentum
- Multi-Timeframe Trend Analysis
- FVG Zones & Order Blocks
- Buy & Sell Directional Signals
- Economic News & Earnings Panel
- 15+ Themes & Full Customization
- Free Lifetime Updates & Support
No payment or credit card required — just your email.
Secure checkout powered by Stripe & PayPal
FAQ
Frequently Asked Questions
Which version of NinjaTrader is supported?
Our indicator is built for NinjaTrader 8. It is not compatible with NinjaTrader 7 or earlier versions.
How do I install the indicator?
After purchase, you'll receive a download link. Simply import the .zip file into NinjaTrader using the Control Center > Tools > Import menu. A detailed installation guide is included.
Can I use it on multiple computers?
Each license is valid for one machine. If you need to transfer your license to a new computer, you can deactivate it from your dashboard and reactivate on the new machine.
Do I get free updates?
Yes! Your one-time purchase includes free updates for life. When we release new features or improvements, you'll get them automatically.
Can I customize the colors and settings easily?
Yes — this is one of the biggest pain points we solved. NinjaTrader's default property grids are notoriously hard to navigate. Our indicator has its own built-in settings menu with 15+ pre-made themes you can switch instantly, plus full control over every color, line style, and toggle. No digging through property panels.
What markets does it work with?
The indicator works with any market available in NinjaTrader — futures (ES, NQ, YM, CL, etc.), stocks, forex, and crypto.
What is your refund policy?
We offer a 14-day money-back guarantee. If you're not satisfied with the indicator, contact us within 14 days of purchase for a full refund.
Our Recommended Platform