The Big Picture: 1-Hour Measured Move With a Lower High
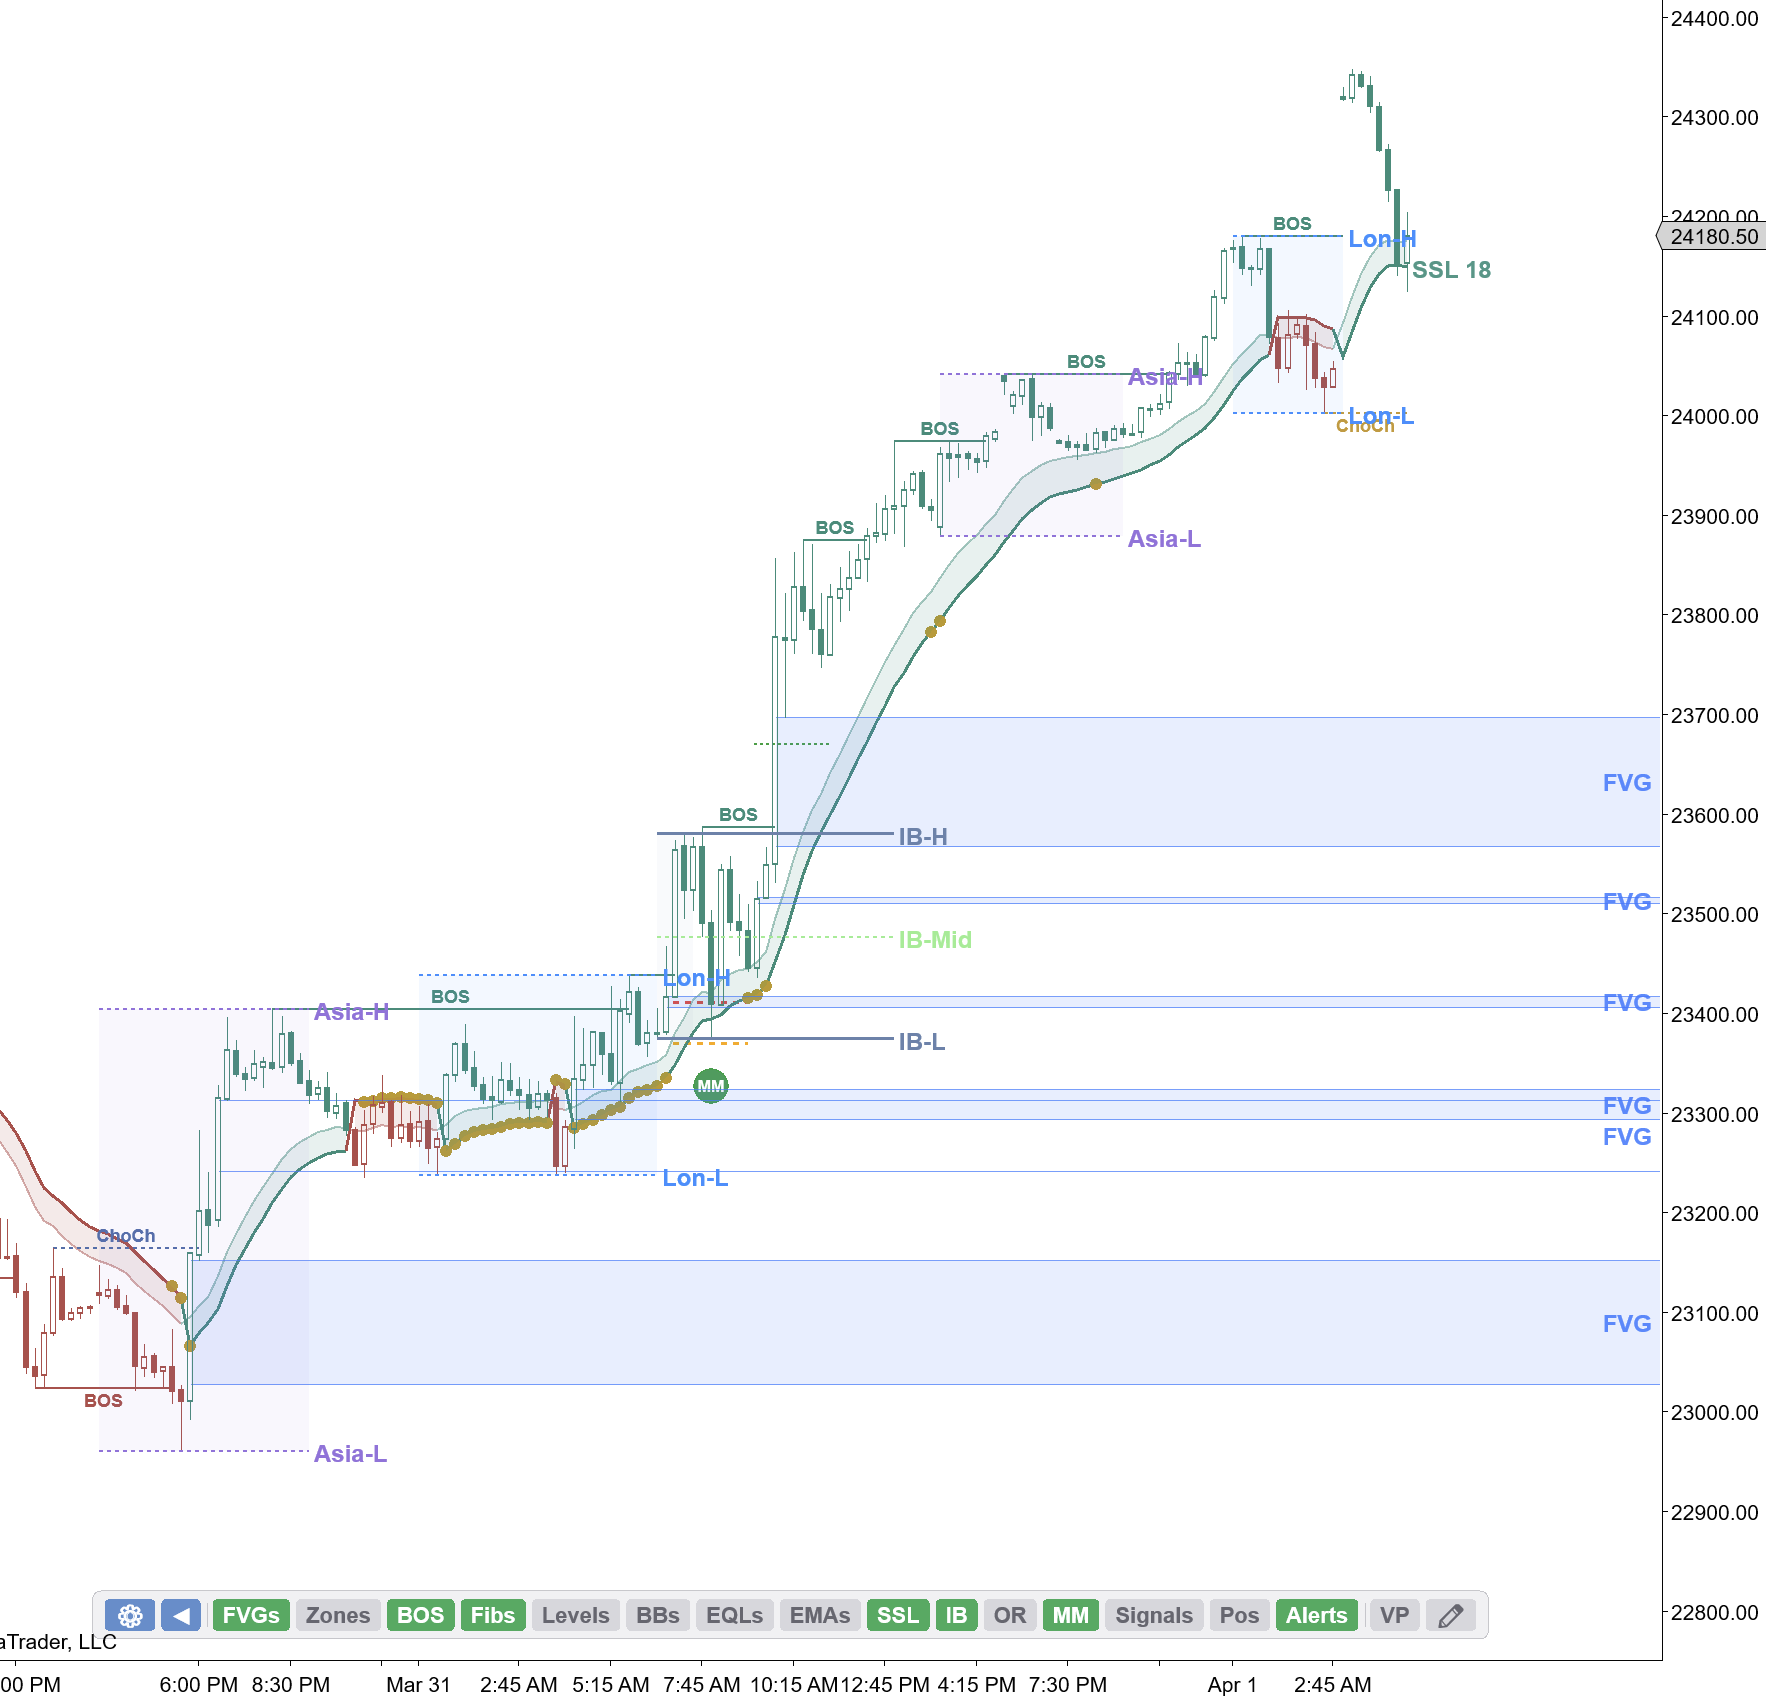
Today's NQDefinitionE-mini Nasdaq 100 futures contract. Known for fast, volatile moves. 1 tick = $5, 1 point = $20. session started with what looked like a bullish recovery. Coming off the lows, price was making higher lows and higher highs on the 2-minute chart. The SSLDefinitionSSL Channel — a trend-following overlay combining moving average crossovers with volatility bands for direction and entries. Cloud flipped bullish, the CHoCHDefinitionChange of Character — the first warning a trend may be ending. Price breaks a swing point against the trend. confirmed, and BOSDefinitionBreak of Structure — price breaks the previous swing point in the trend direction. Confirms continuation. labels were printing to the upside. If you were only looking at the 2-minute, you would have thought we were going straight up.
But the 1-hour told a completely different story.
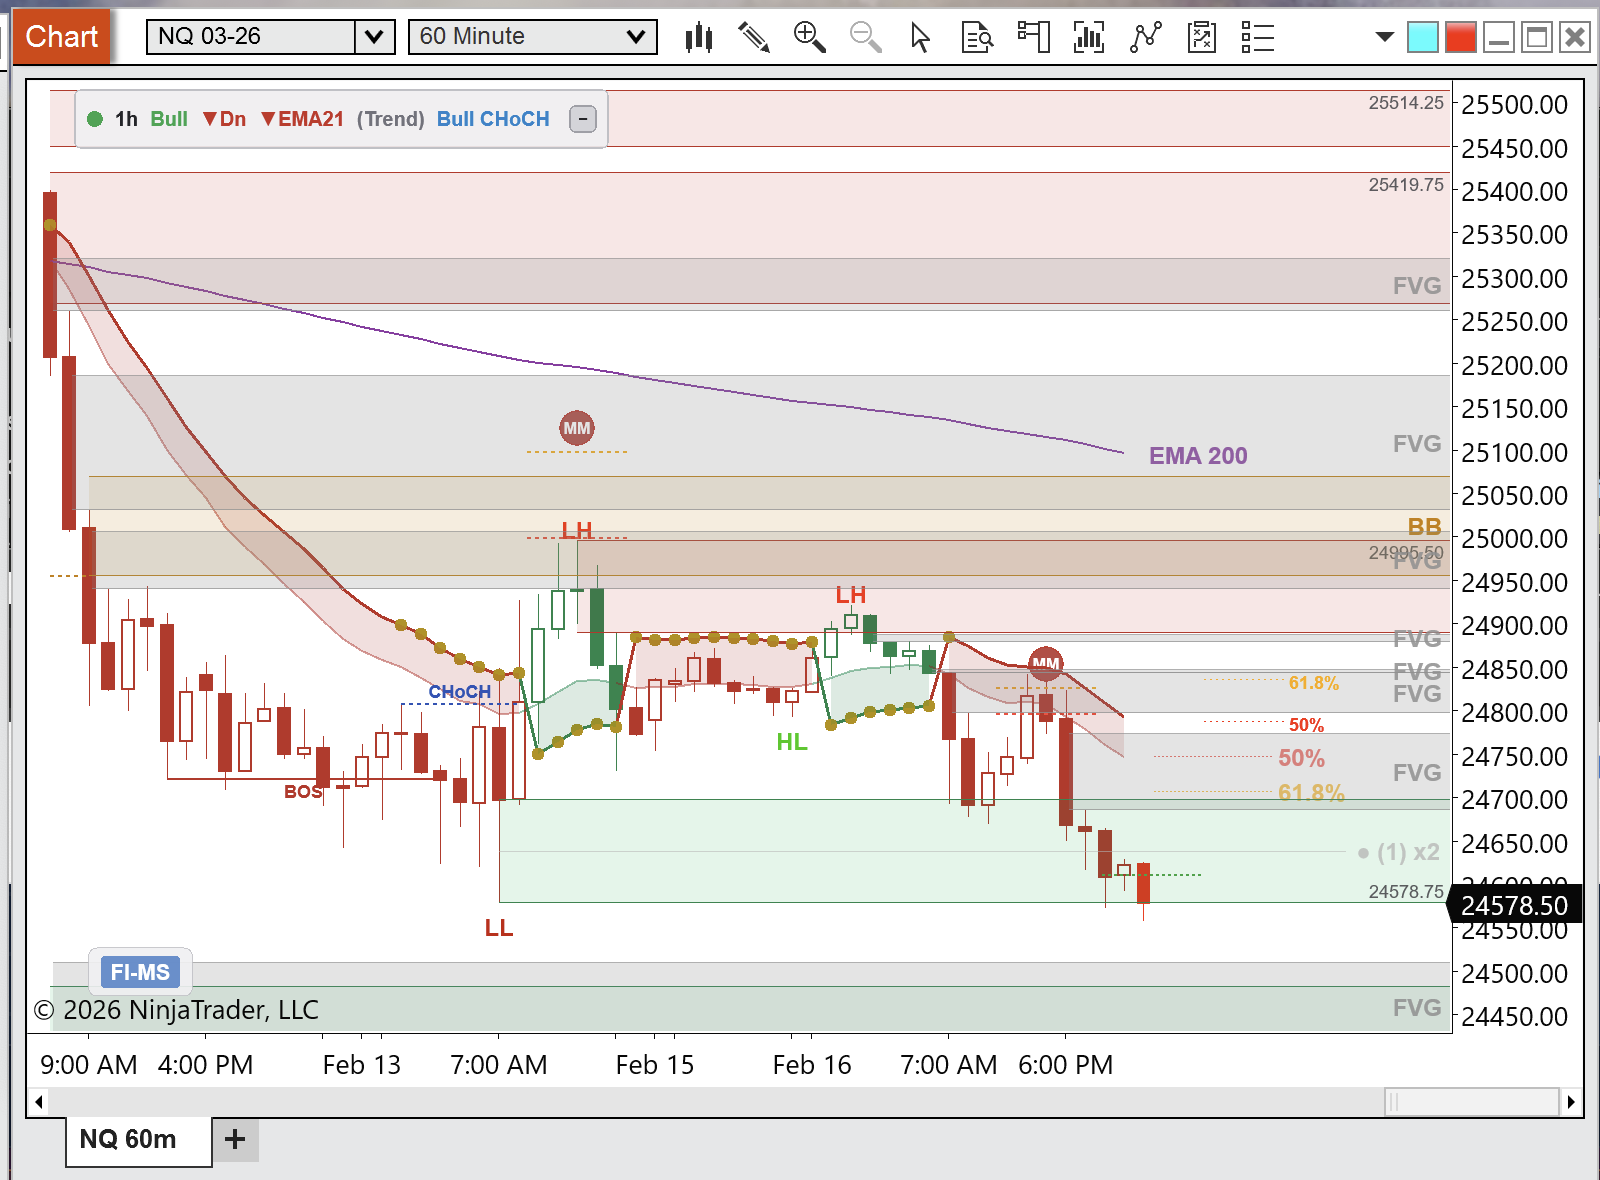
On the 1-hour, NQDefinitionE-mini Nasdaq 100 futures contract. Known for fast, volatile moves. 1 tick = $5, 1 point = $20. was printing a textbook lower high inside a larger bearish structure. The prior swing down had established the measured moveDefinitionA price projection where Leg B equals Leg A. Primary target is the -23.6% extension beyond 100%. levels, and the 50% retracement was sitting right where price was grinding into. The EMADefinitionExponential Moving Average — weights recent prices more heavily than older ones for faster trend response. 200 was above, FVGsDefinitionFair Value Gap — a three-candle pattern leaving a price void. Price tends to return and fill these gaps. were stacked as resistance overhead, and a breaker blockDefinitionA failed order block that flips from support to resistance (or vice versa). Key level for retest entries. was capping the move.
Key Insight
When the 2-minute says bullish but the 1-hour says lower high at the 50% measured move — the higher timeframe context matters more.
This is why multi-timeframe analysis matters. The 2-minute was showing you the noise. The 1-hour was showing you the trade.
The 2-Minute: Bullish Structure Builds, Then Cracks
Let's zoom into the 2-minute to see exactly how the long side set up and then fell apart.
Early in the session, NQDefinitionE-mini Nasdaq 100 futures contract. Known for fast, volatile moves. 1 tick = $5, 1 point = $20. was putting in a clean bullish structure. CHoCHDefinitionChange of Character — the first warning a trend may be ending. Price breaks a swing point against the trend. fired off the lows, BOSDefinitionBreak of Structure — price breaks the previous swing point in the trend direction. Confirms continuation. confirmed to the upside, and the SSLDefinitionSSL Channel — a trend-following overlay combining moving average crossovers with volatility bands for direction and entries. Cloud was green. The measured moveDefinitionA price projection where Leg B equals Leg A. Primary target is the -23.6% extension beyond 100%. badge was flashing. If you took the long side here, that was the right call at the time — structure supported it.
But here is where it gets interesting. Price pushed up into the IBDefinitionInitial Balance — the price range of the first hour of regular trading. Sets the day's reference range.-H and HOD area and started stalling. The higher highs were getting weaker. The momentum was dying. And on the 1-hour, we were sitting right at that 50% measured moveDefinitionA price projection where Leg B equals Leg A. Primary target is the -23.6% extension beyond 100%. level with the lower high forming.
The Turn: CHoCH and BOS Flip Bearish on 2-Minute
This is the moment that separates the professionals from the retail traders. The 2-minute structure broke.
CHoCHDefinitionChange of Character — the first warning a trend may be ending. Price breaks a swing point against the trend. fired to the downside. Then BOSDefinitionBreak of Structure — price breaks the previous swing point in the trend direction. Confirms continuation. confirmed. The SSLDefinitionSSL Channel — a trend-following overlay combining moving average crossovers with volatility bands for direction and entries. Cloud flipped from green to red. The measured moveDefinitionA price projection where Leg B equals Leg A. Primary target is the -23.6% extension beyond 100%. badge appeared — this time pointing down. The entire bullish thesis on the 2-minute was invalidated in minutes.
Key Insight
The CHoCH on the 2-minute was the early warning. The BOS was the confirmation. Once both fired, the 1-hour thesis — short at the lower high — was fully in play.
The Entry: 15-Minute Confirms at the 61.8%
Now let's look at the 15-minute to see the final piece of the puzzle.
The 15-minute was painting a measured moveDefinitionA price projection where Leg B equals Leg A. Primary target is the -23.6% extension beyond 100%. short. Price had pushed up, stalled, and the 61.8% Fibonacci retracement was sitting right at the entry level. The measured move badge labeled it PERFECT — a star rating — because the entry aligned with the fib, the structure, and the 1-hour thesis all at once.
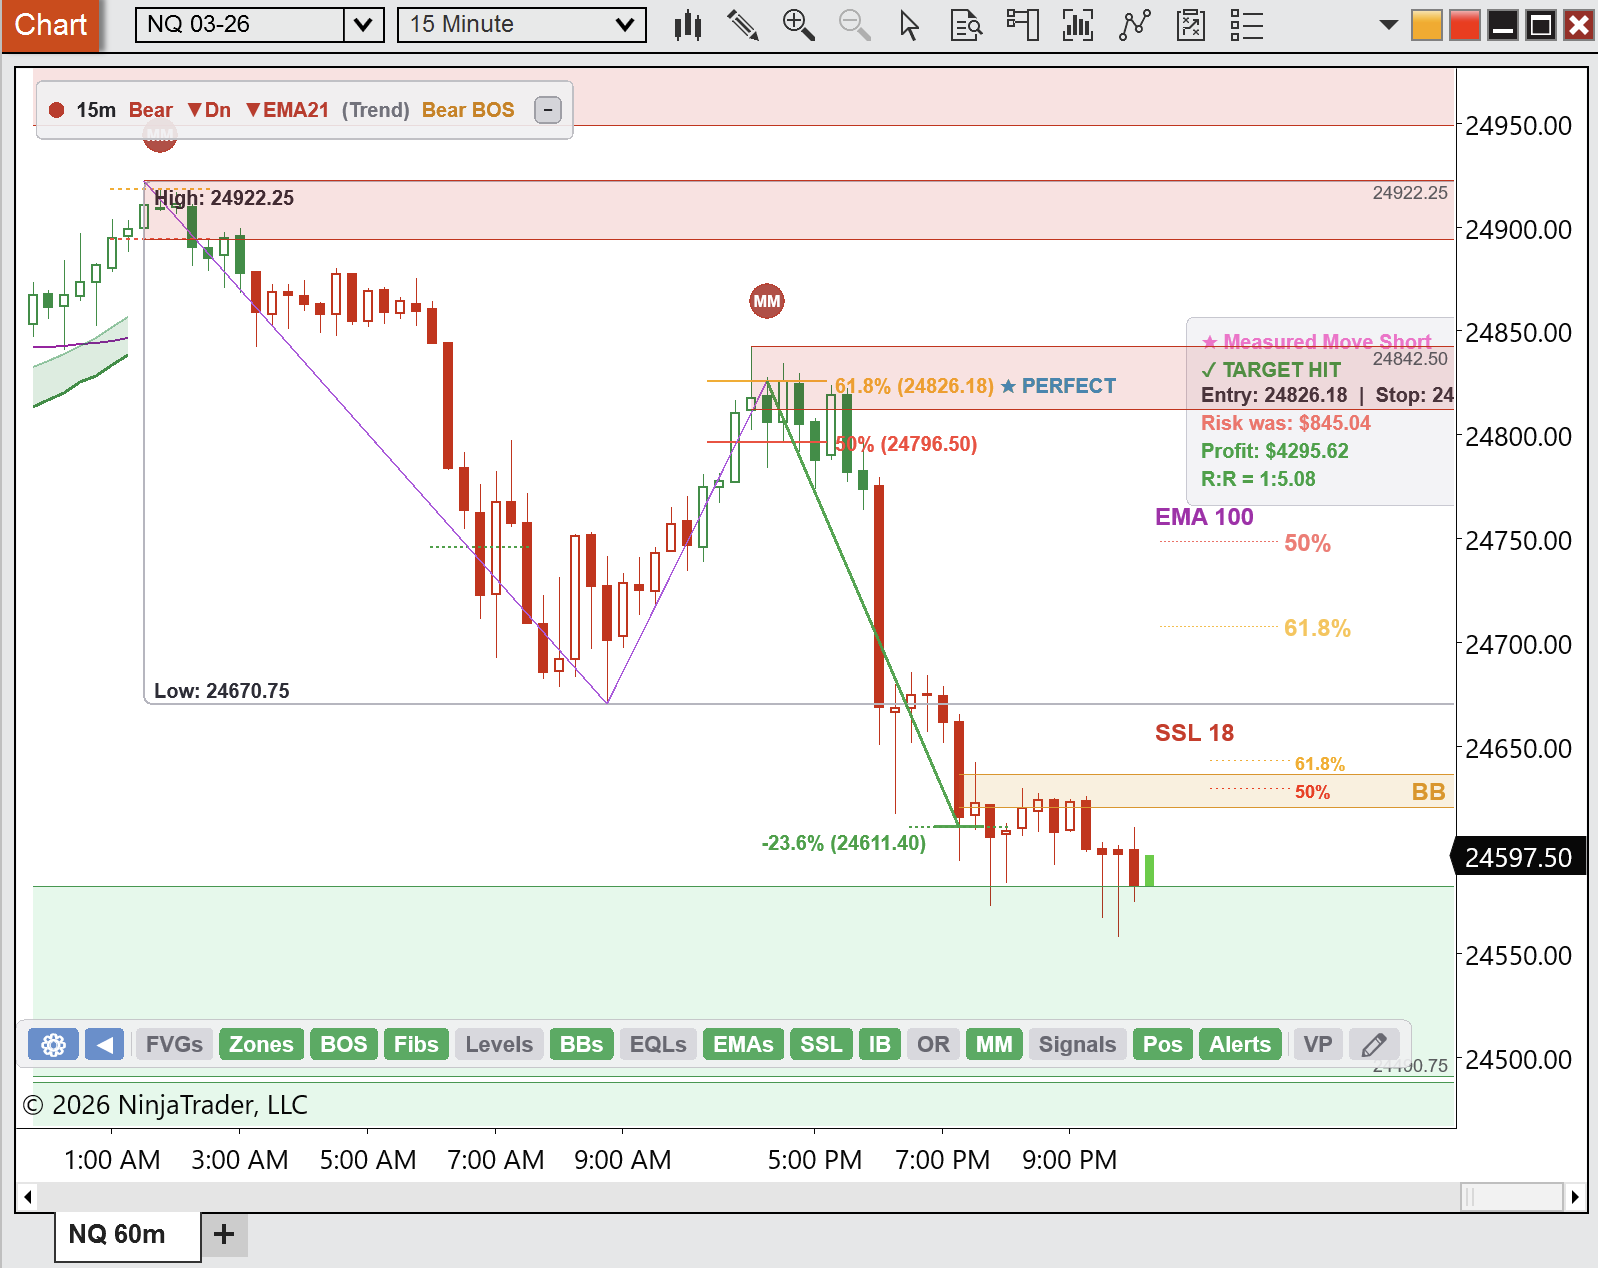
Entry at 24826.18. Stop above the prior high. Target down at the session low area.
And sure enough, NQDefinitionE-mini Nasdaq 100 futures contract. Known for fast, volatile moves. 1 tick = $5, 1 point = $20. rolled over. The measured moveDefinitionA price projection where Leg B equals Leg A. Primary target is the -23.6% extension beyond 100%. short hit target as the thesis played out across all three timeframes.
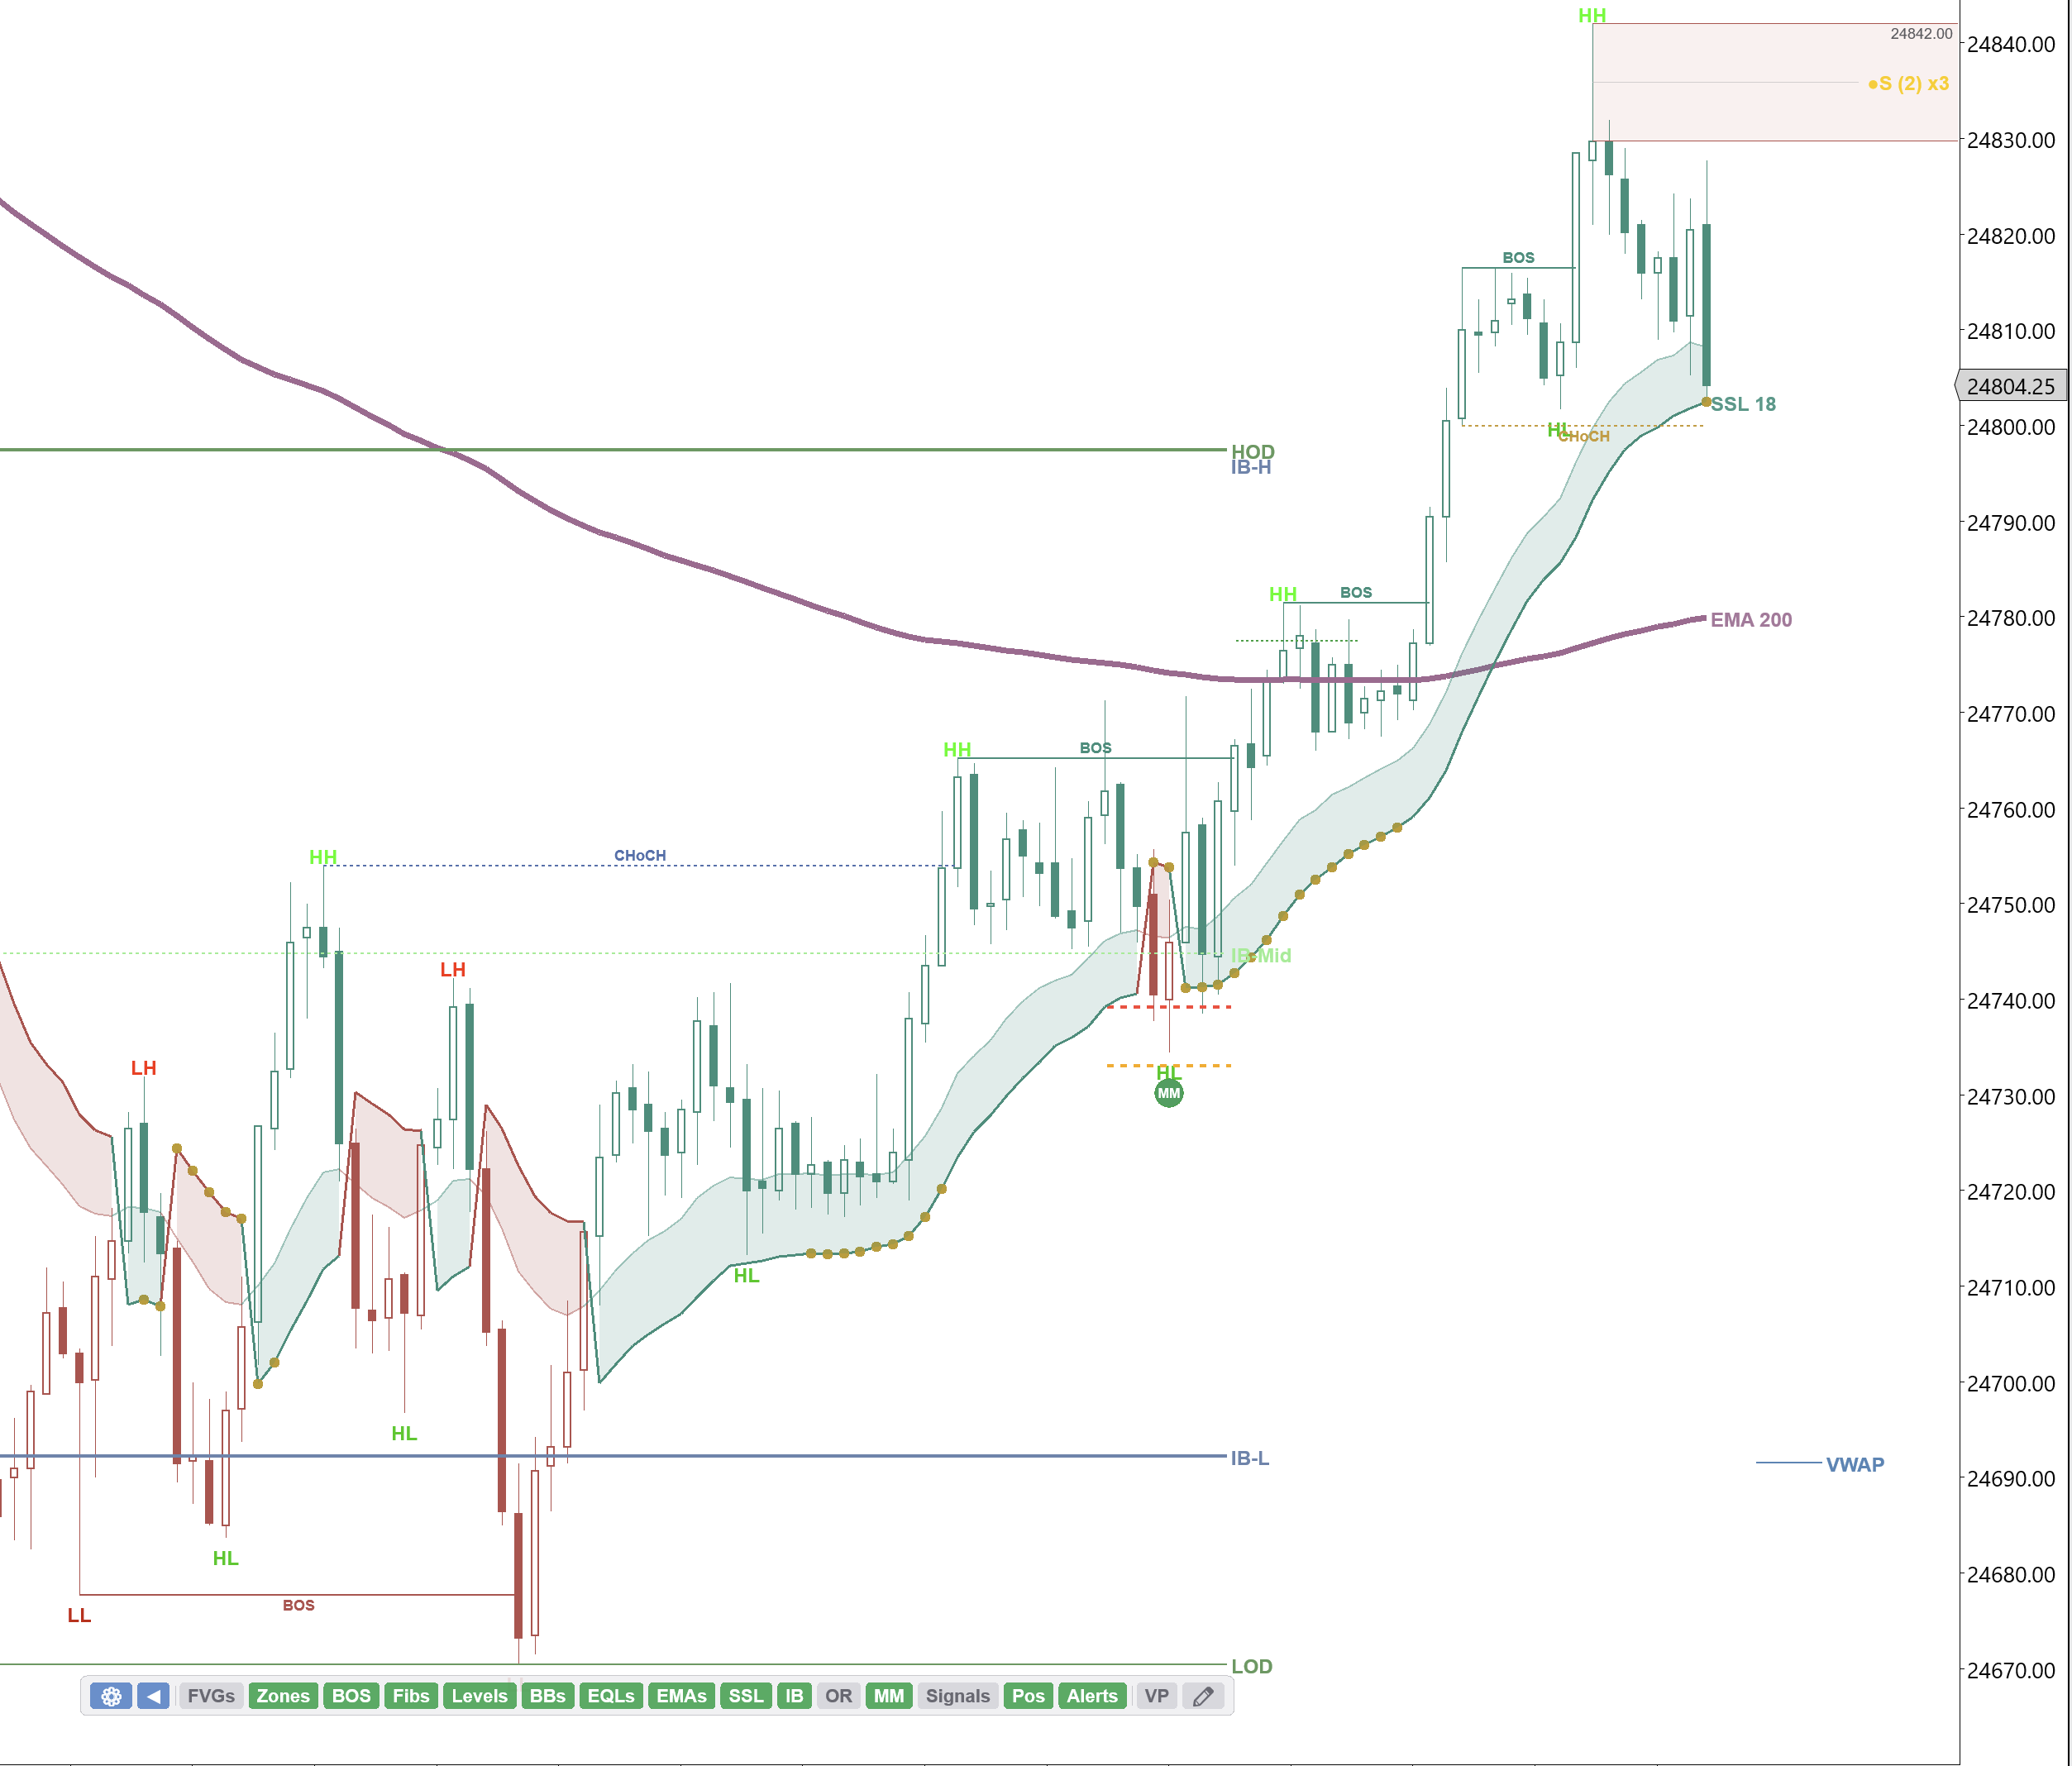
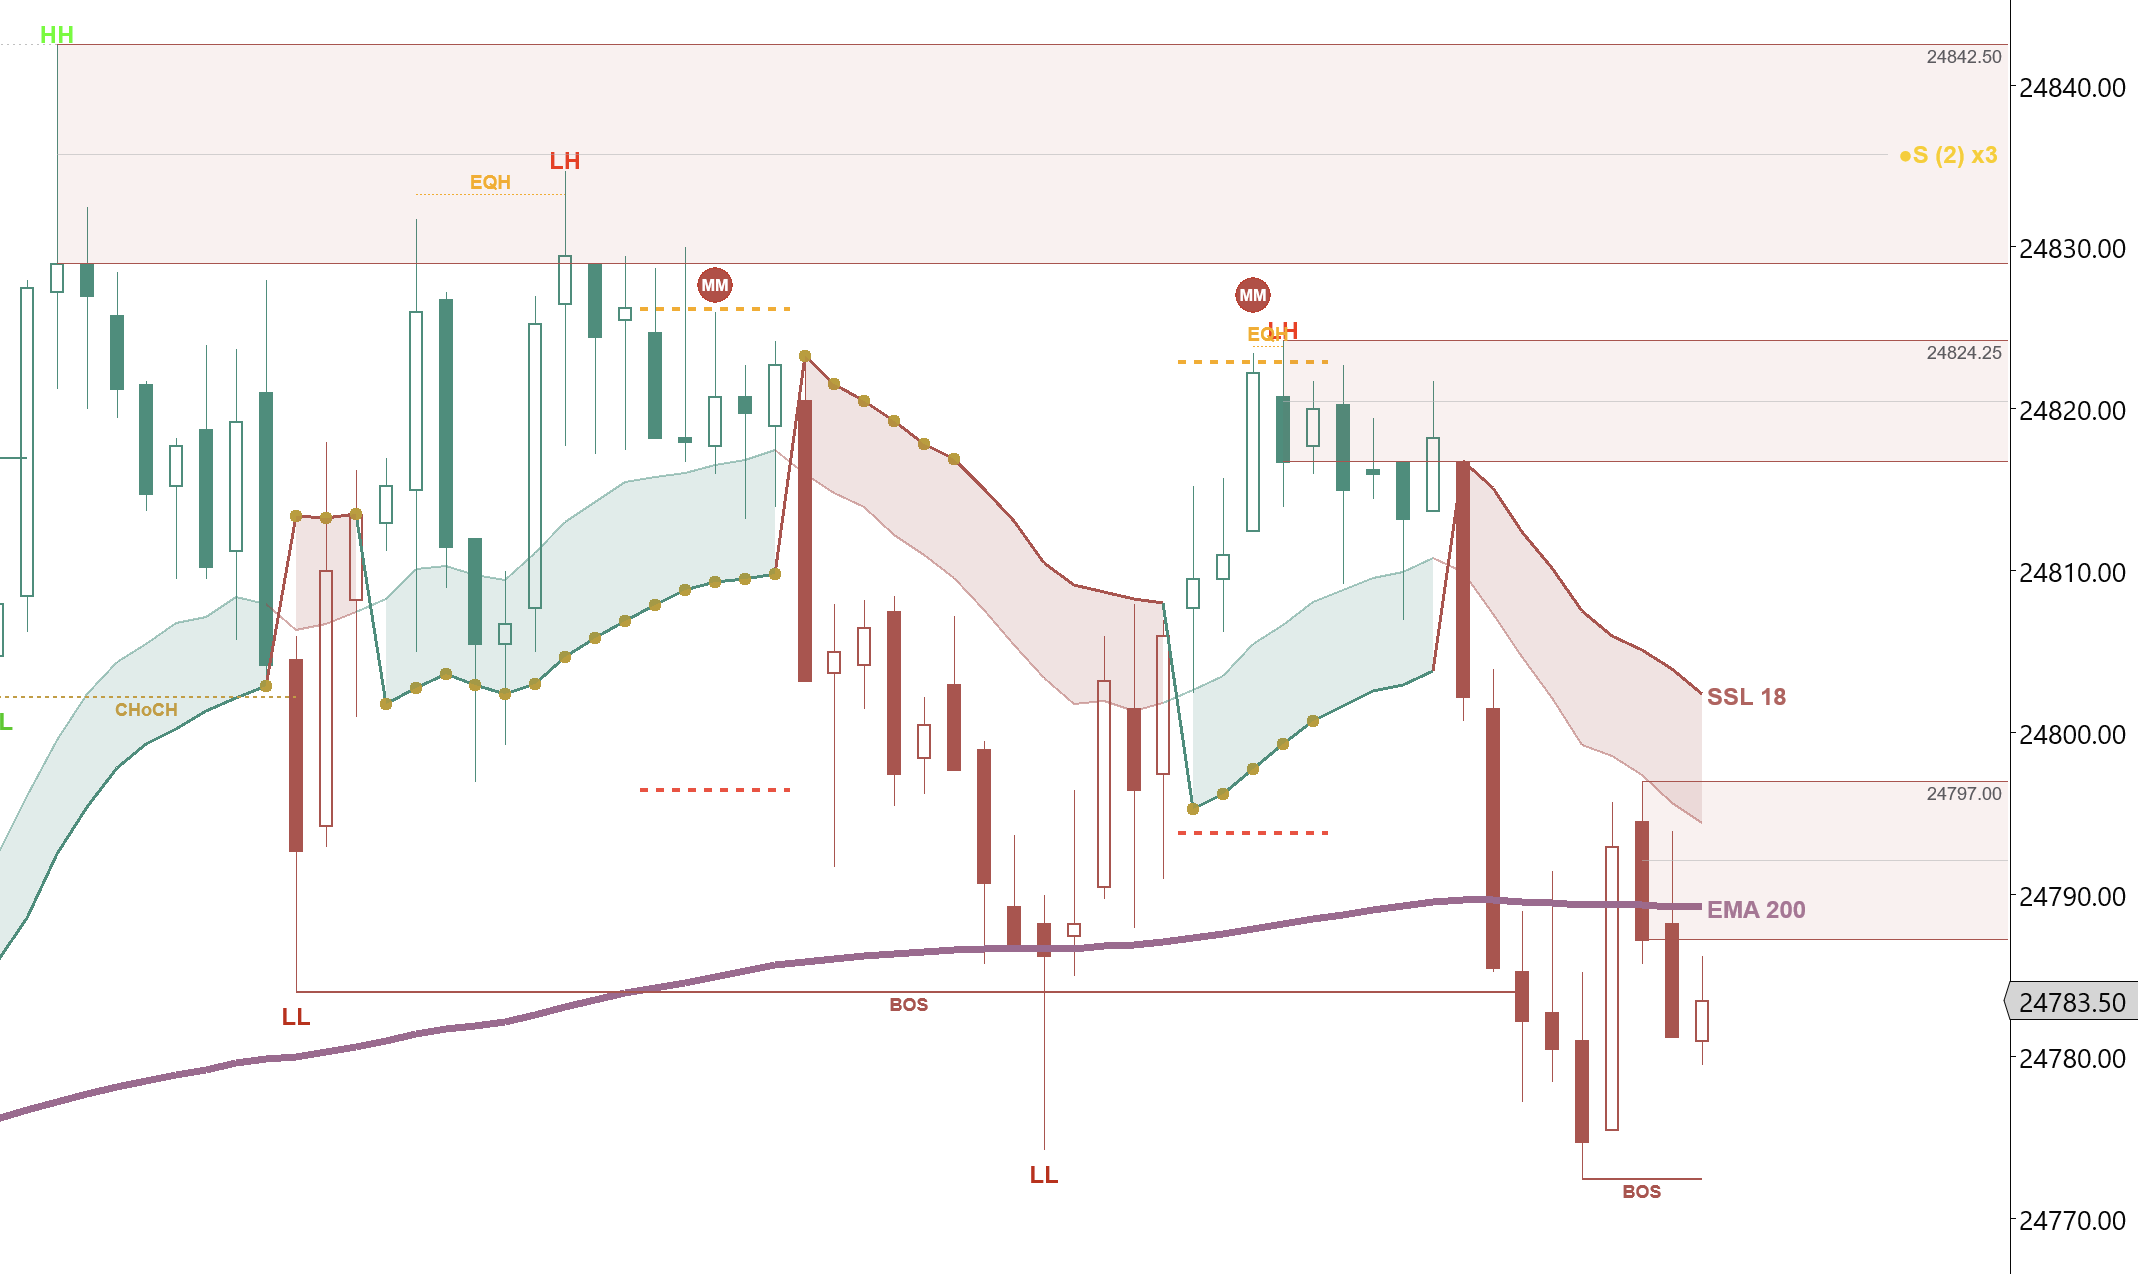
The Aftermath: Full Breakdown on the 2-Minute
After the short triggered, NQDefinitionE-mini Nasdaq 100 futures contract. Known for fast, volatile moves. 1 tick = $5, 1 point = $20. did not just drop — it cascaded. The 2-minute showed BOSDefinitionBreak of Structure — price breaks the previous swing point in the trend direction. Confirms continuation. after BOS to the downside. Every bounce was sold. The SSLDefinitionSSL Channel — a trend-following overlay combining moving average crossovers with volatility bands for direction and entries. Cloud stayed red. The measured movesDefinitionA price projection where Leg B equals Leg A. Primary target is the -23.6% extension beyond 100%. kept stacking short.
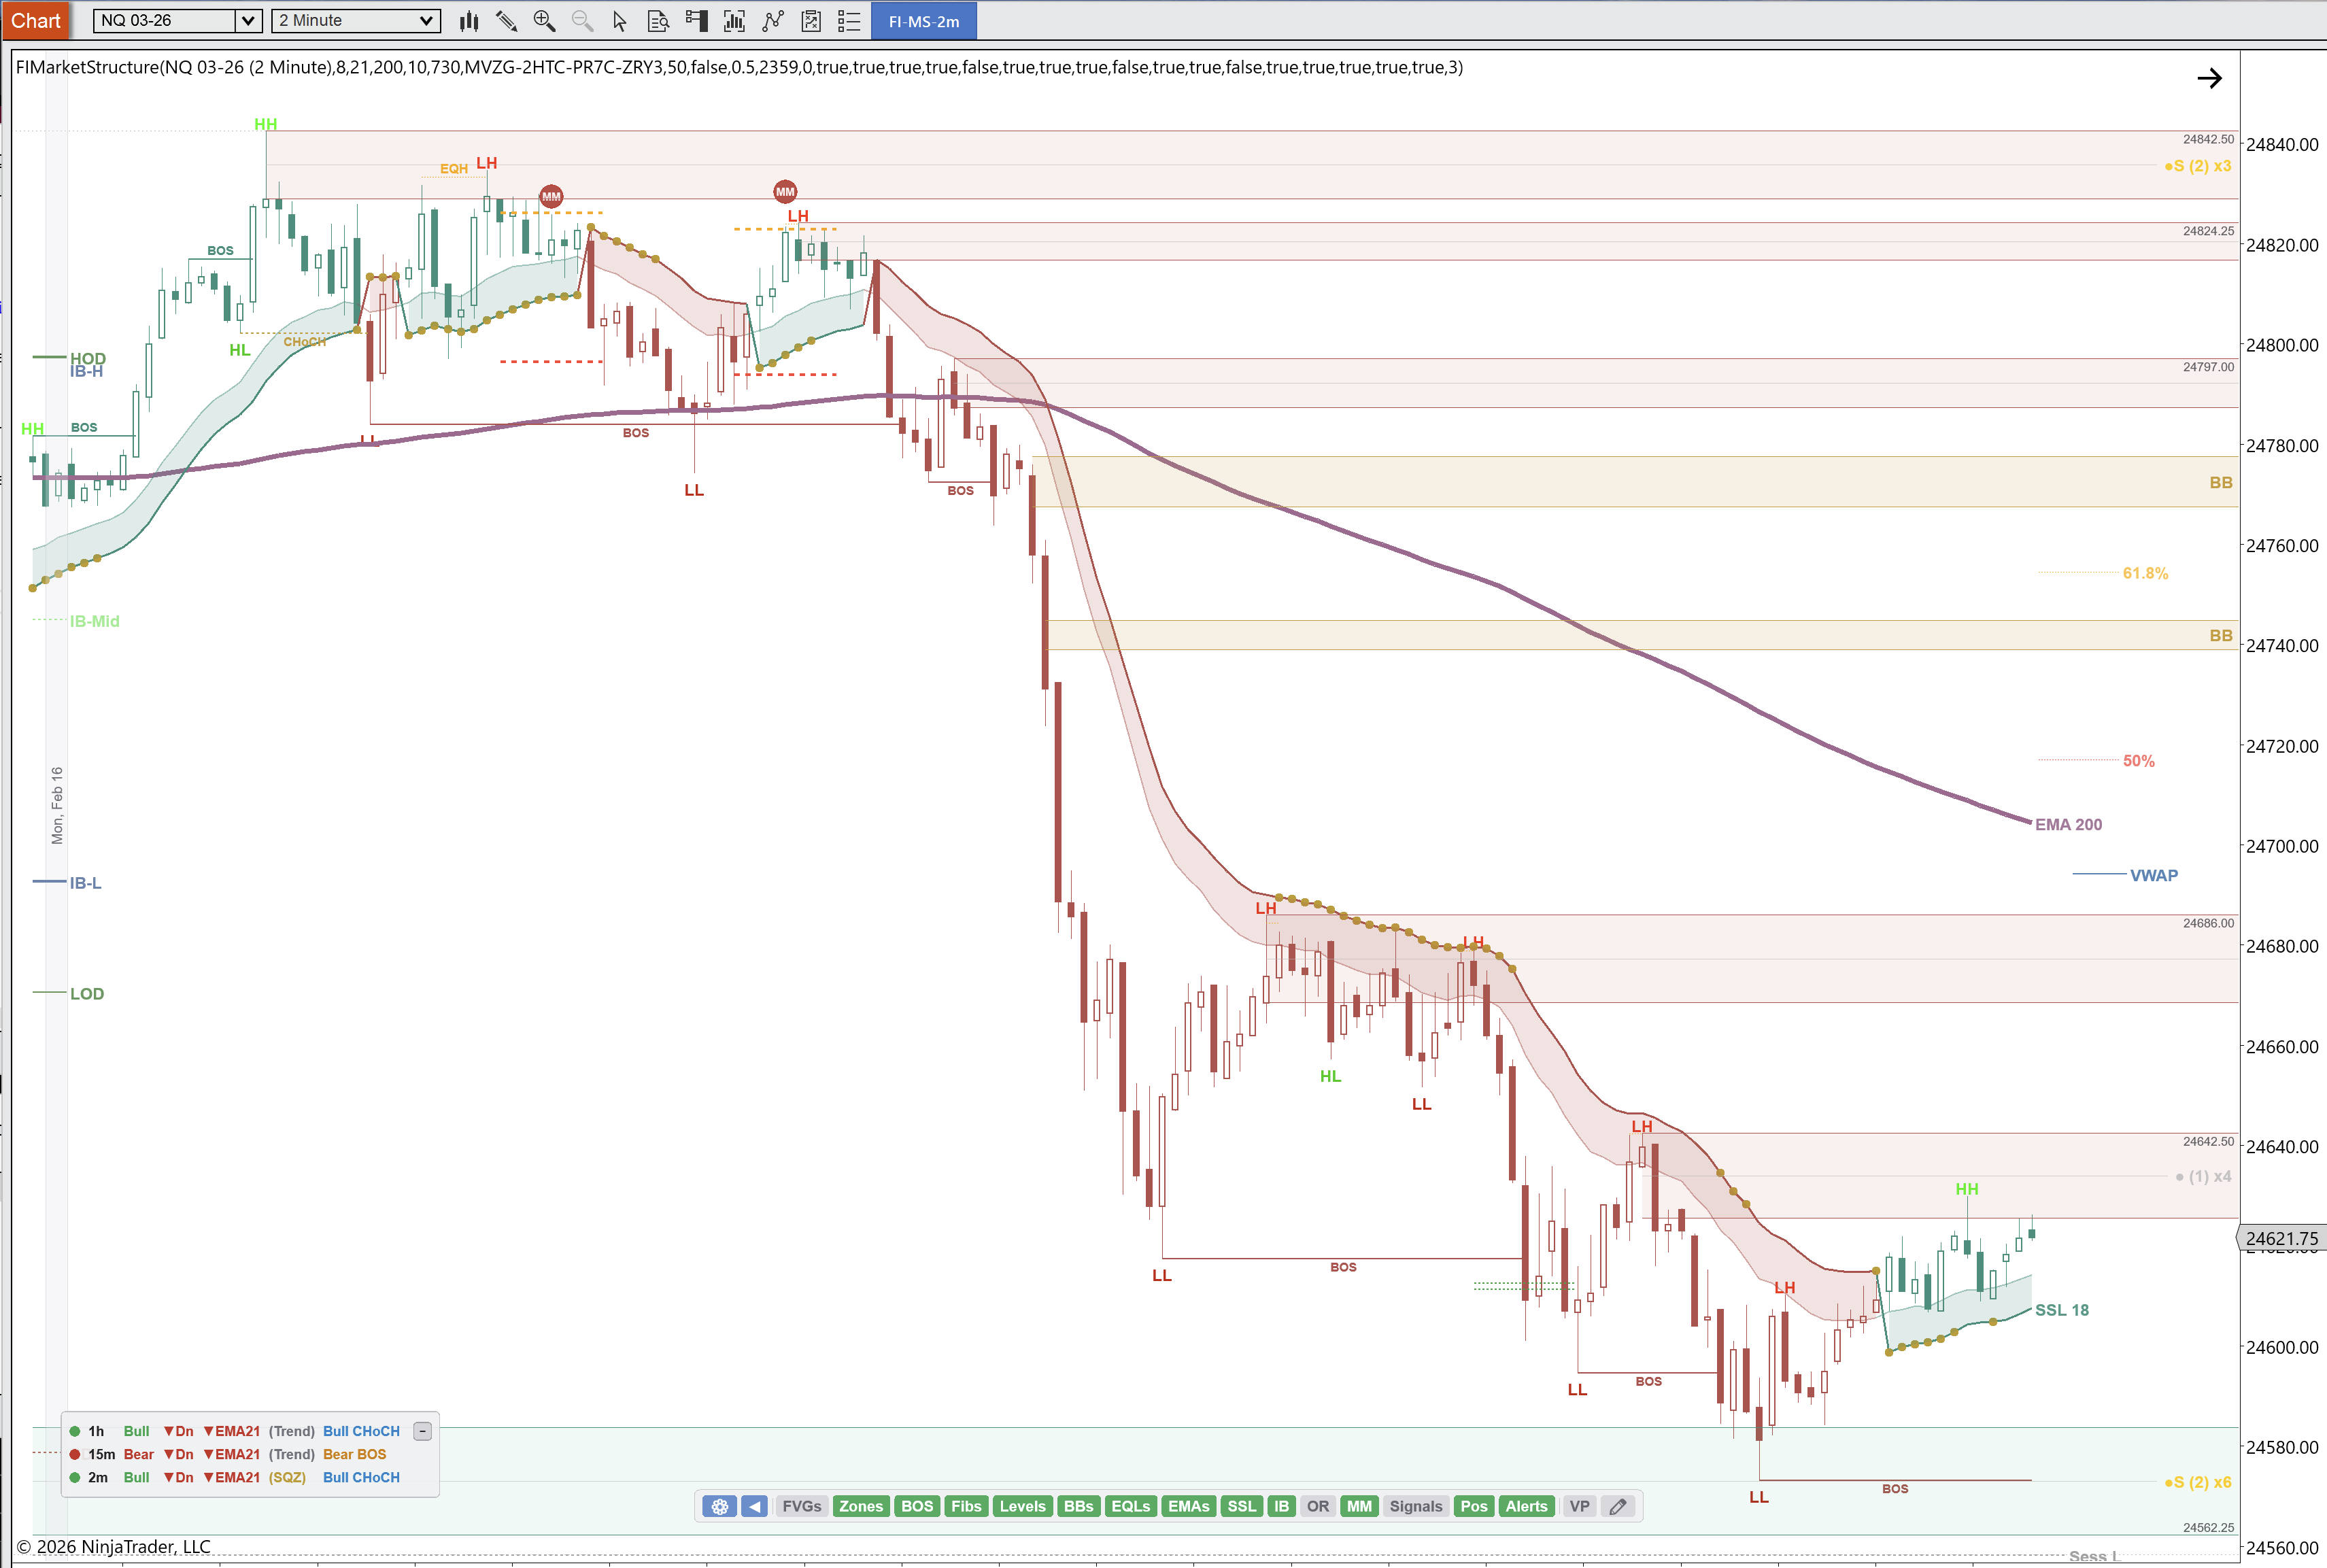
NQDefinitionE-mini Nasdaq 100 futures contract. Known for fast, volatile moves. 1 tick = $5, 1 point = $20. dropped from the 24842 high all the way down through 24600 — a 280-point move. The IBDefinitionInitial Balance — the price range of the first hour of regular trading. Sets the day's reference range. range was completely abandoned. Every level of support broke. The LOD kept printing lower and lower as sellers piled on.
Key Insight
This is what happens when the 1-hour, 15-minute, and 2-minute all agree. The move is not a scalp — it is a trend day. And if you had the thesis from the 1-hour measured move, you were positioned before the crowd even saw it coming.
Multi-Timeframe Alignment: The Key to This Trade
Let's break down exactly why this trade worked:
1-Hour: The Thesis Lower high forming at the 50% measured move. EMA 200 overhead. FVGs stacked as resistance. Bearish structure still intact from the prior swing. This told you the direction — short.
15-Minute: The Entry Measured move short at the 61.8% fib. PERFECT rating. R:R of 1:5.08. This told you where to enter and where to put your stop.
2-Minute: The Timing CHoCH fired first. BOS confirmed. SSL Cloud flipped red. This told you when to pull the trigger.
Key Insight
The 1-hour tells you what to trade. The 15-minute tells you where to trade it. The 2-minute tells you when. All three aligned today for a textbook short.
Key Takeaways
This trade was not a guess. It was not a gamble. Every element was plotted on the chart before the entry:
The 1-hour measured moveDefinitionA price projection where Leg B equals Leg A. Primary target is the -23.6% extension beyond 100%. level was visible all morning. The 15-minute 61.8% fib was drawn before price arrived. The 2-minute CHoCHDefinitionChange of Character — the first warning a trend may be ending. Price breaks a swing point against the trend. and BOSDefinitionBreak of Structure — price breaks the previous swing point in the trend direction. Confirms continuation. confirmed the structural shift in real-time.
All you had to do was wait for alignment across timeframes and execute the plan.
Key Insight
When the higher timeframe gives you a thesis, the mid timeframe gives you a level, and the lower timeframe gives you confirmation — that is the highest probability setup in futures trading. Today was a textbook example.
One trade. Three timeframes. Zero chasing.