Why the Retest Trade Works
The retest trade is built on a simple principle: after a significant move, price tends to retrace and test the breakout level before continuing in the original direction. This happens because of the natural market cycle of impulse and correction.
When a break of structure occurs, it creates a new supply or demand zoneDefinitionA price area where buyers previously overwhelmed sellers. Expect buying when price returns here.. Smart money uses the retracement to add to positions or initiate new ones at favorable prices. Retail traders who chased the initial move get stopped out during the retest, providing the liquidityDefinitionResting orders (stop losses, limit orders) at known levels. Institutions need liquidity to fill large positions. that smart money needs.
The 5-Step Retest Trade Process
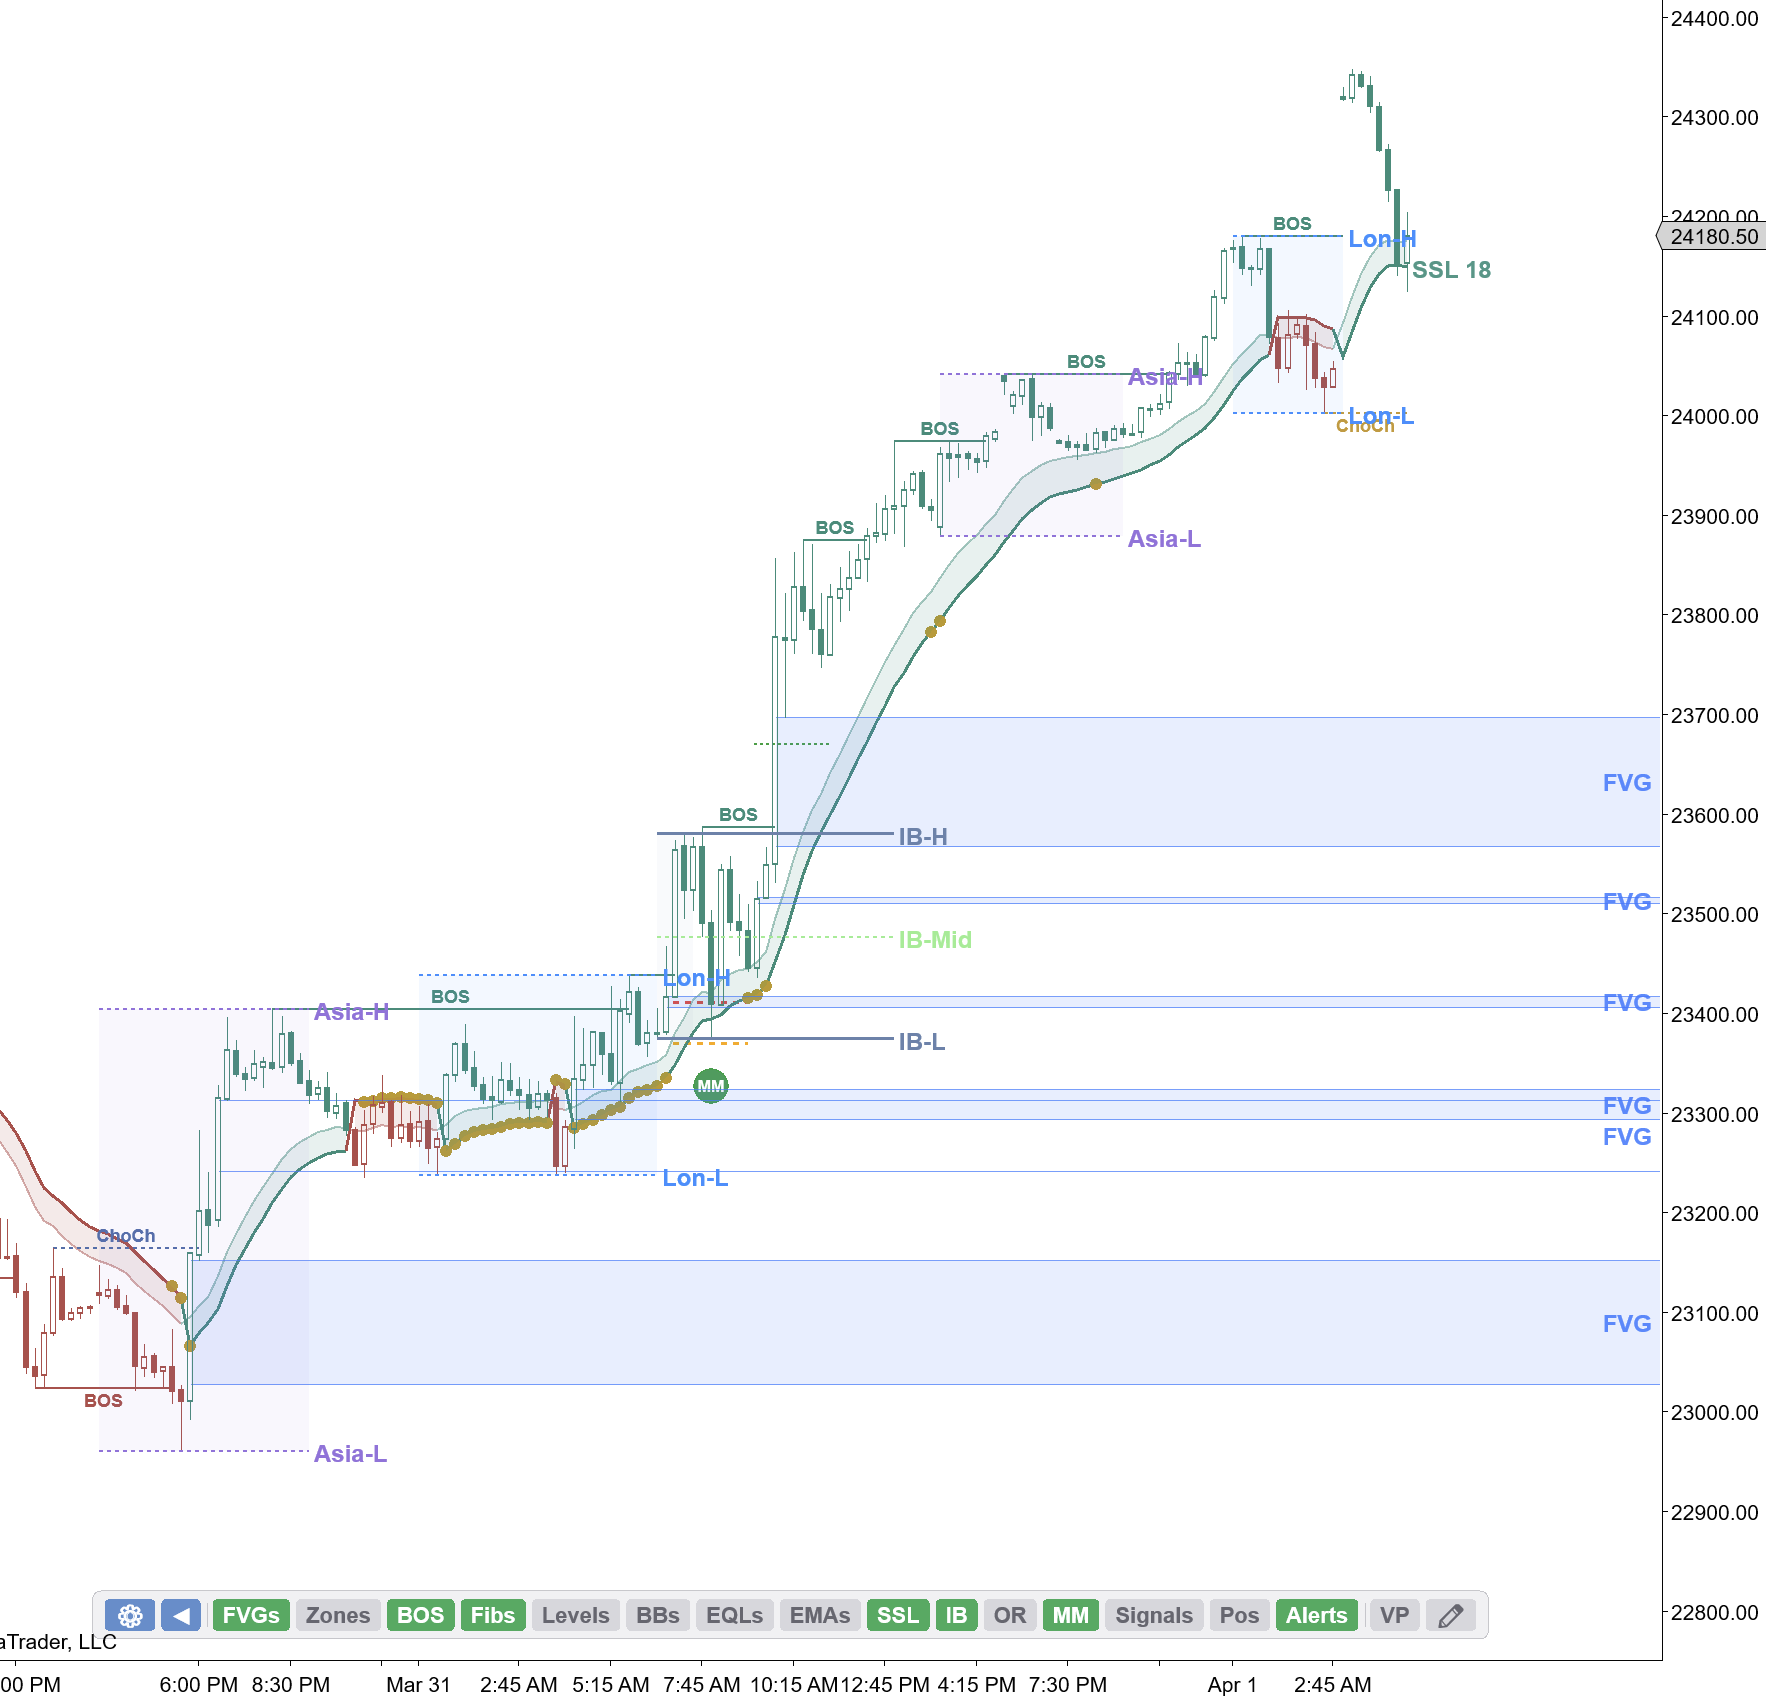
Step 1: Identify the Break of Structure
The first step is always identifying a clear break of structure on your higher timeframe chart. For futures trading on the NQ or ES, the 1-hour and 4-hour charts work best for identifying the macro structure.
A valid BOSDefinitionBreak of Structure — price breaks the previous swing point in the trend direction. Confirms continuation. should break clearly beyond a prior swing pointDefinitionLocal peaks (swing highs) and troughs (swing lows). The building blocks of all market structure.. Marginal breaks or wicks that barely touch the level are not reliable signals. You want a decisive close beyond the level.
Step 2: Mark the Key Retest Level
Once the BOSDefinitionBreak of Structure — price breaks the previous swing point in the trend direction. Confirms continuation. is confirmed, identify the level where price is most likely to retrace to. The best retest levels include:
Breaker blocksDefinitionA failed order block that flips from support to resistance (or vice versa). Key level for retest entries. from the prior swing highDefinitionA peak on the chart where price reversed lower. Marks where sellers previously overpowered buyers. or low. Order blocksDefinitionThe last opposing candle before an impulse move. Where the institutional order originated. where the initial move originated. Fair value gapsDefinitionA three-candle pattern where the wick of Candle 1 doesn't overlap Candle 3, leaving a gap. Price tends to revisit. that were created during the impulse. Previous support that should now act as resistance, or vice versa.
Key Insight
The strongest setups occur when multiple levels converge at the same price zone, creating a confluence area.
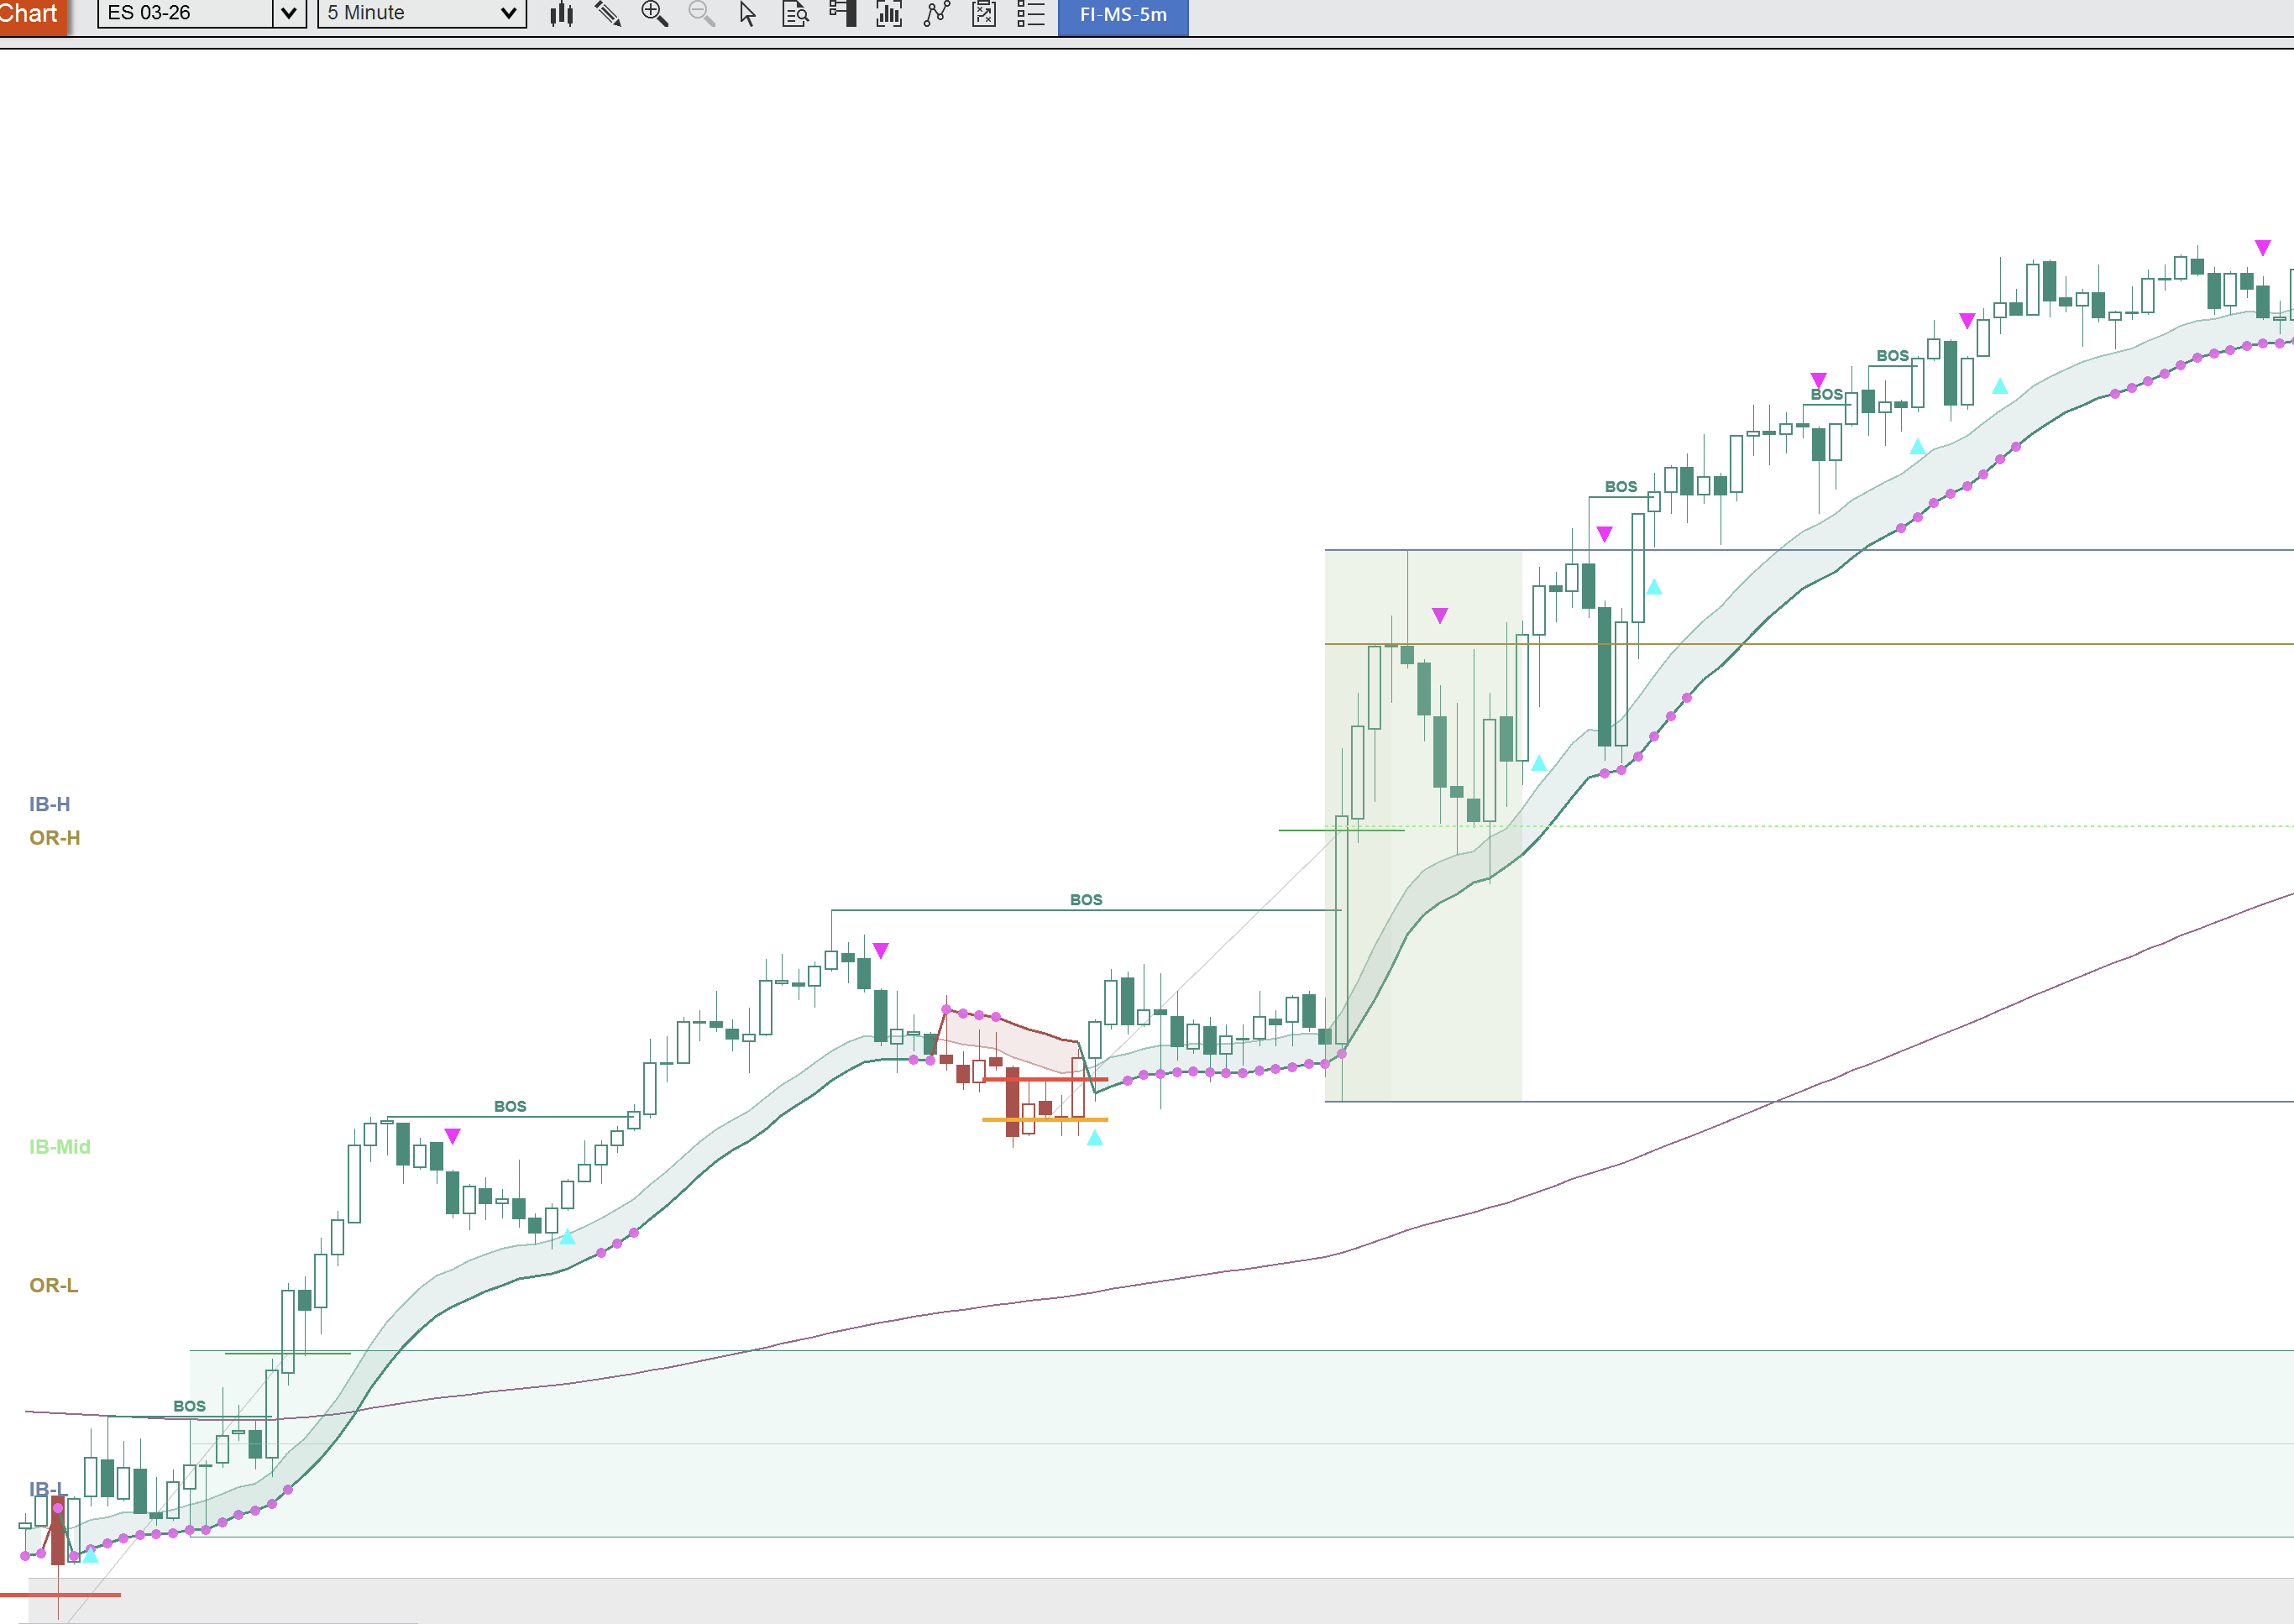
Step 3: Wait for Price to Reach the Level
This is the hardest step for most traders because it requires patience. Price may take hours or even days to retrace to your level. The temptation to enter early or chase a partial move is strong, but discipline here is what separates profitable traders from the rest.
Set an alert at your key level and walk away. Do not sit and watch every candle. When your alert fires, then you start paying attention.
Step 4: Look for Confirmation
Price reaching your level is not enough. You need confirmation that the level is holding. This is where you drop to a lower timeframe, typically the 5-minute or 15-minute chart, and look for:
Rejection wicks off the level showing sellers or buyers stepping in. A squeezeDefinitionLow volatility compression — Bollinger Bands inside Keltner Channels. Expect an explosive move when it fires. firing at the level indicating volatility compression. A lower timeframe BOSDefinitionBreak of Structure — price breaks the previous swing point in the trend direction. Confirms continuation. in the direction of your trade confirming the retest is complete. Volume spikes showing institutional participation at the level.
The more confirmation signals you see, the higher probability the setup becomes.
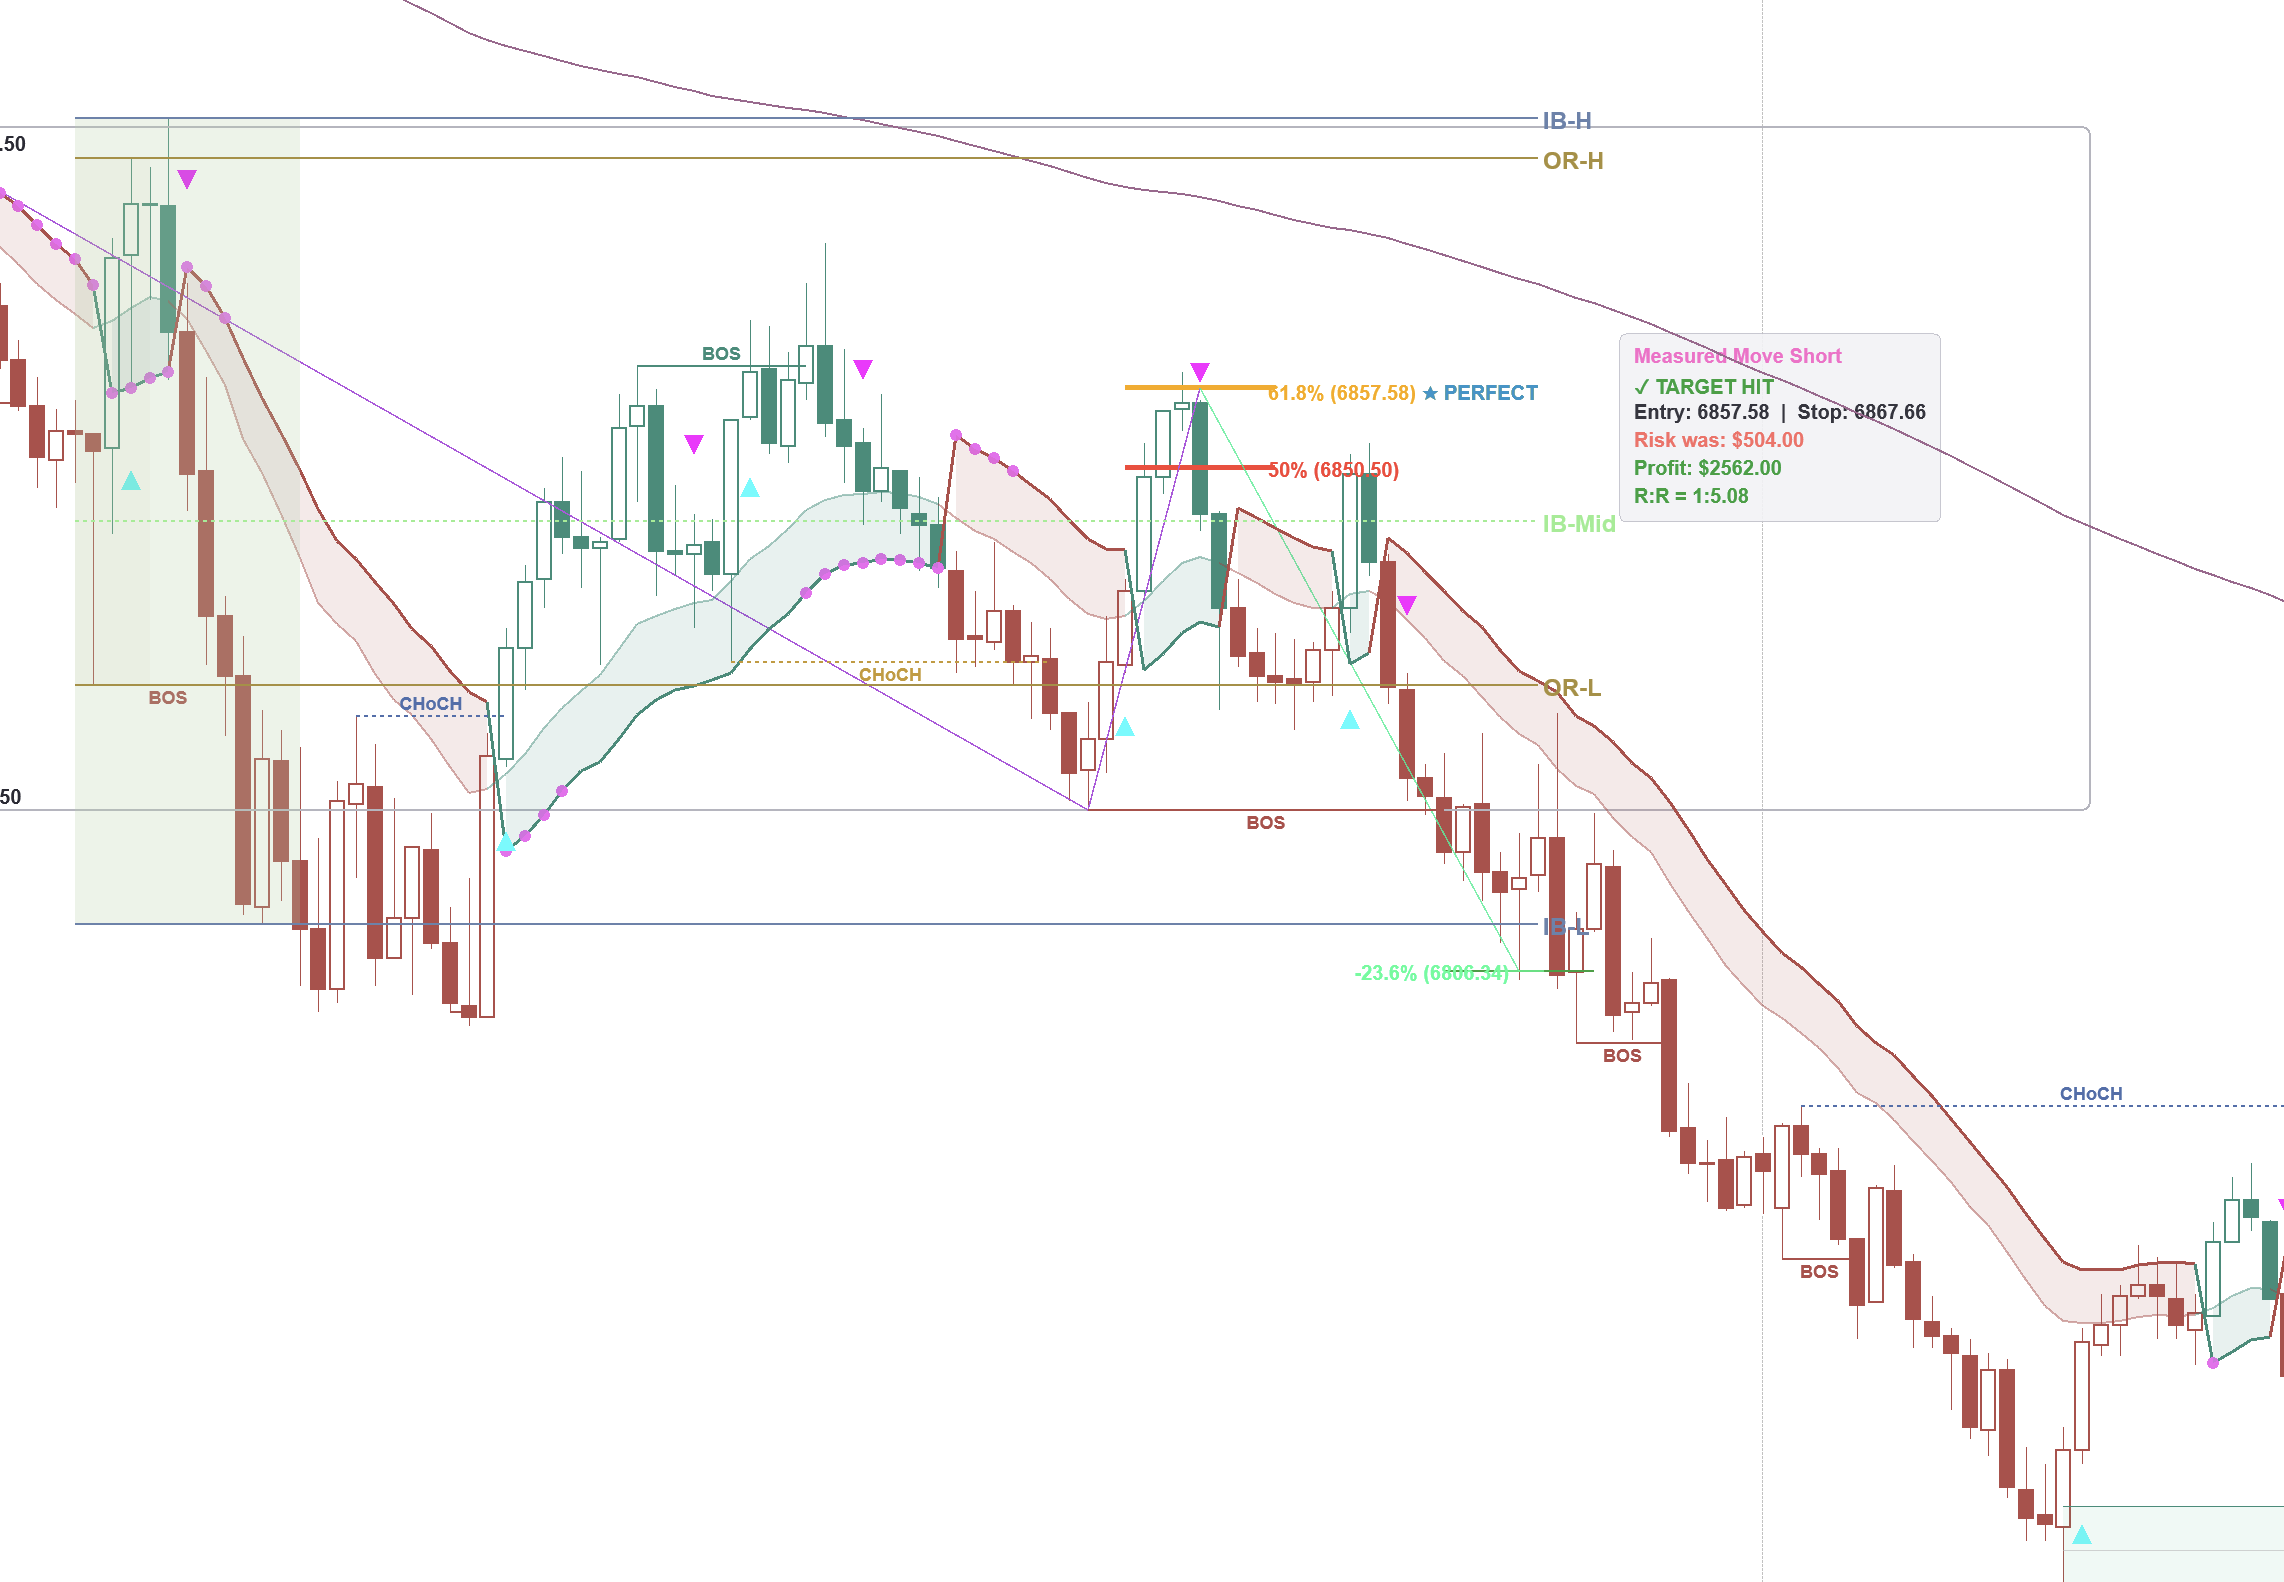
Step 5: Execute with a Tight Stop
Once you have confirmation, enter the trade with your stop loss just beyond the retest level. For a bearish retest, your stop goes above the resistance zone. For a bullish retest, your stop goes below the support zone.
Your target should be at minimum 2:1 risk-to-reward, but the best retest trades often deliver 3:1 or better because you are entering early in the continuation move.
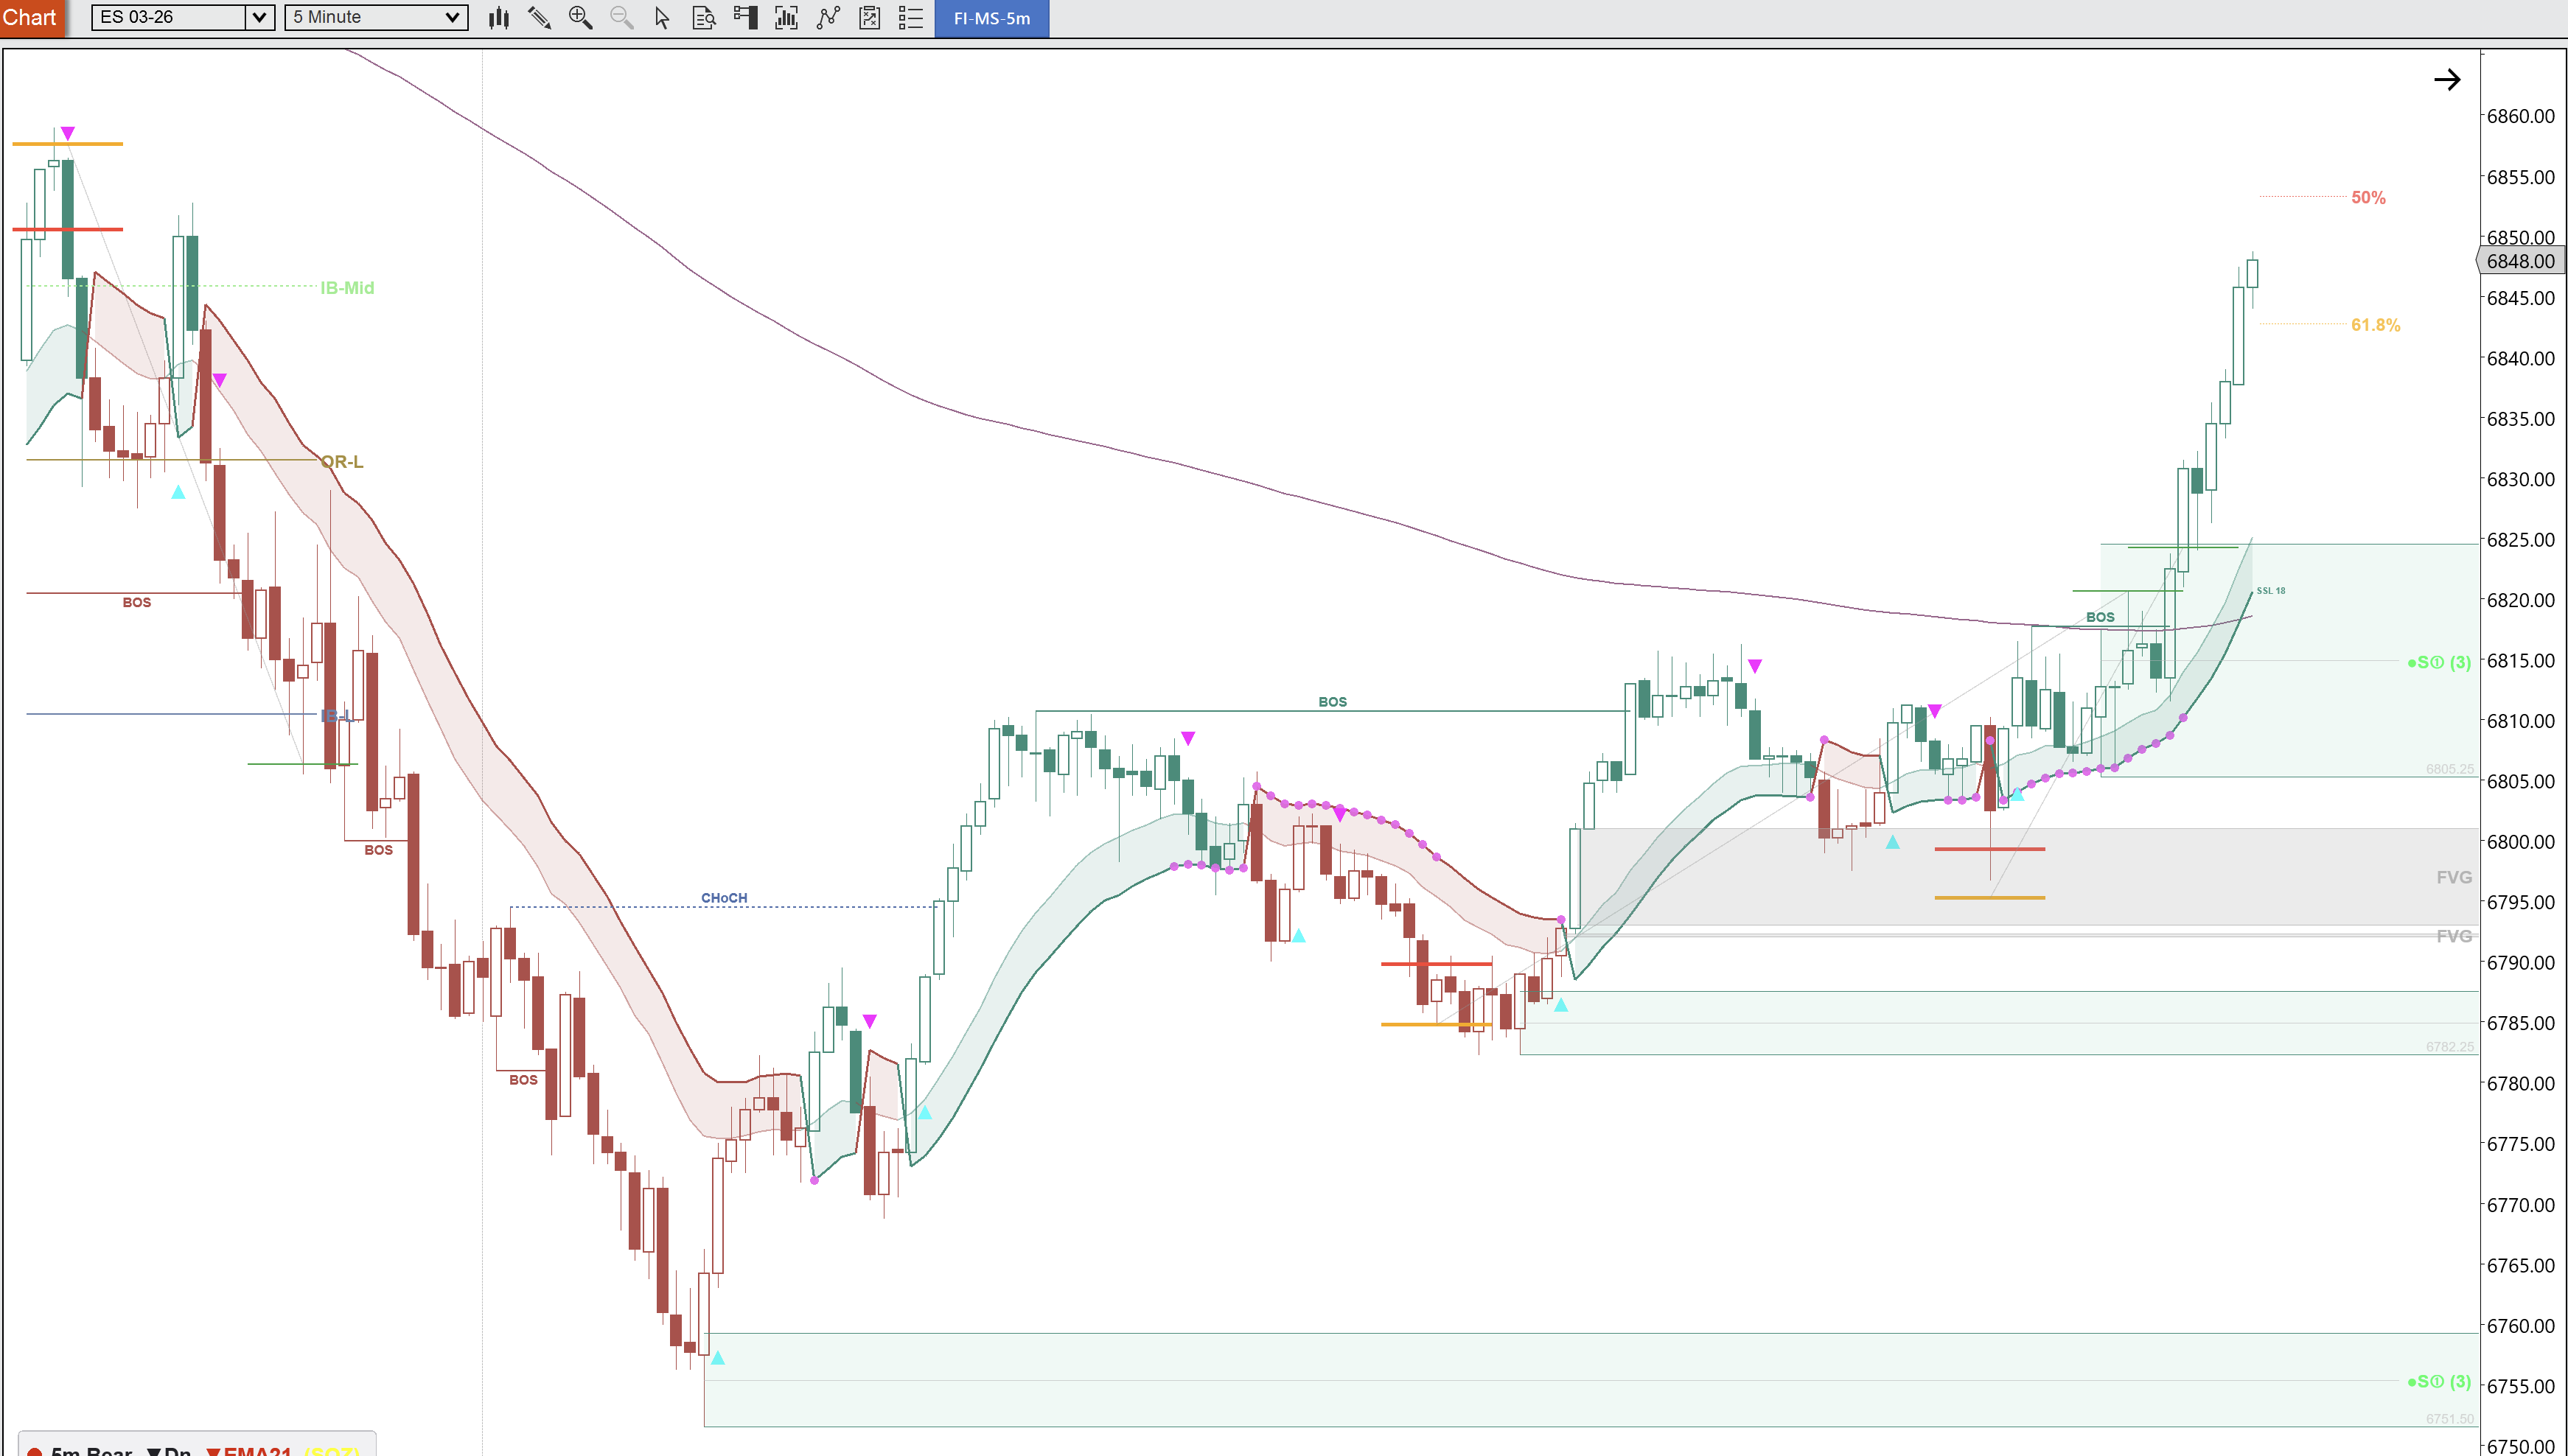
Why the Squeeze Matters
One of the most powerful confirmation signals for a retest trade is the squeezeDefinitionLow volatility compression — Bollinger Bands inside Keltner Channels. Expect an explosive move when it fires.. When price retraces to a key level and starts consolidating, volatility compresses. This compression creates a coiled spring effect.
Key Insight
A squeeze firing at a known support or resistance level after a break of structure is one of the highest probability setups in futures trading.
When the squeezeDefinitionLow volatility compression — Bollinger Bands inside Keltner Channels. Expect an explosive move when it fires. releases, it provides the energy for the continuation move.
Common Mistakes with Retest Trades
Entering Before Confirmation Jumping in as soon as price touches the level is not a retest trade, it is a limit order gamble. Wait for the level to prove it is holding before committing capital.
Using Too Wide a Stop The beauty of the retest trade is the tight stop. If your stop needs to be wide, the level is not clean enough. Move on and wait for a better setup.
Ignoring the Higher Timeframe The retest must align with the higher timeframe structure. If you are trying to trade a 5-minute retest against the 1-hour trend, you are fighting the market.
Trading Every Retest Not every retest is tradeable. The best setups have confluence: structure, key levels, squeeze confirmation, and volume. If you are not seeing multiple signals align, pass on the trade.
Putting It All Together
Key Insight
The retest trade is not complicated, but it requires discipline. Identify structure, mark your level, wait for price to arrive, confirm the level is holding, and execute with a tight stop.
No chasing, no guessing, no emotional decisions. This is how professional futures traders generate consistent returns. They do not need to trade every day. They wait for the setup, execute the plan, and let the market come to them.
The tools you use to identify these setups matter. A market structure indicator that automatically labels BOSDefinitionBreak of Structure — price breaks the previous swing point in the trend direction. Confirms continuation., highlights key levels, and fires squeezeDefinitionLow volatility compression — Bollinger Bands inside Keltner Channels. Expect an explosive move when it fires. signals takes the manual work out of the process and ensures you never miss a high-probability retest trade.